• Photonics Research
  • Vol. 5, Issue 5, 494 (2017)
R. Dubey1、*, B. Vosoughi Lahijani1, M. H?yrinen2, M. Roussey2, M. Kuittinen2, and H. P. Herzig1
Author Affiliations
  • 1Optics & Photonics Technology Laboratory (OPT), école Polytechnique Fédérale de Lausanne (EPFL), rue de la Maladière 71b, CH-2002 Neuchatel, Switzerland
  • 2Institute of Photonics, University of Eastern Finland, P.O. Box 111, 80101 Joensuu, Finland
  • show less
    DOI: 10.1364/PRJ.5.000494 Cite this Article Set citation alerts
    R. Dubey, B. Vosoughi Lahijani, M. H?yrinen, M. Roussey, M. Kuittinen, H. P. Herzig. Ultra-thin Bloch-surface-wave-based reflector at telecommunication wavelength[J]. Photonics Research, 2017, 5(5): 494 Copy Citation Text show less
    Schematic of the setup of the TIR configuration for BSW coupling with dielectric multilayers deposited on a glass wafer. The 2D grating patterned in the waveguide is fabricated on the top of the multilayers into a 60-nm-thick TiO2 layer. The SNOM probe, in collection mode, is used to observe the interaction of the BSW with the grating in the near field.
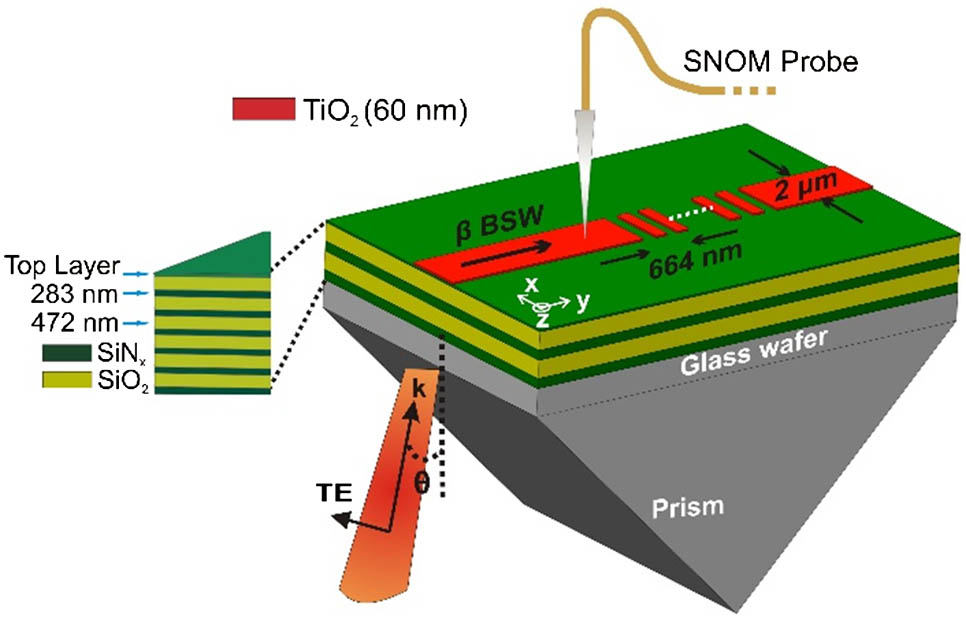
    Fig. 1. Schematic of the setup of the TIR configuration for BSW coupling with dielectric multilayers deposited on a glass wafer. The 2D grating patterned in the waveguide is fabricated on the top of the multilayers into a 60-nm-thick TiO2 layer. The SNOM probe, in collection mode, is used to observe the interaction of the BSW with the grating in the near field.
    Simulations using CST Microwave Studio, FDTD method. (a) Field amplitude distribution over the waveguide at a wavelength of λ=1500 nm, (b) field amplitude distribution over the waveguide at the Bragg wavelength λ=1553 nm.
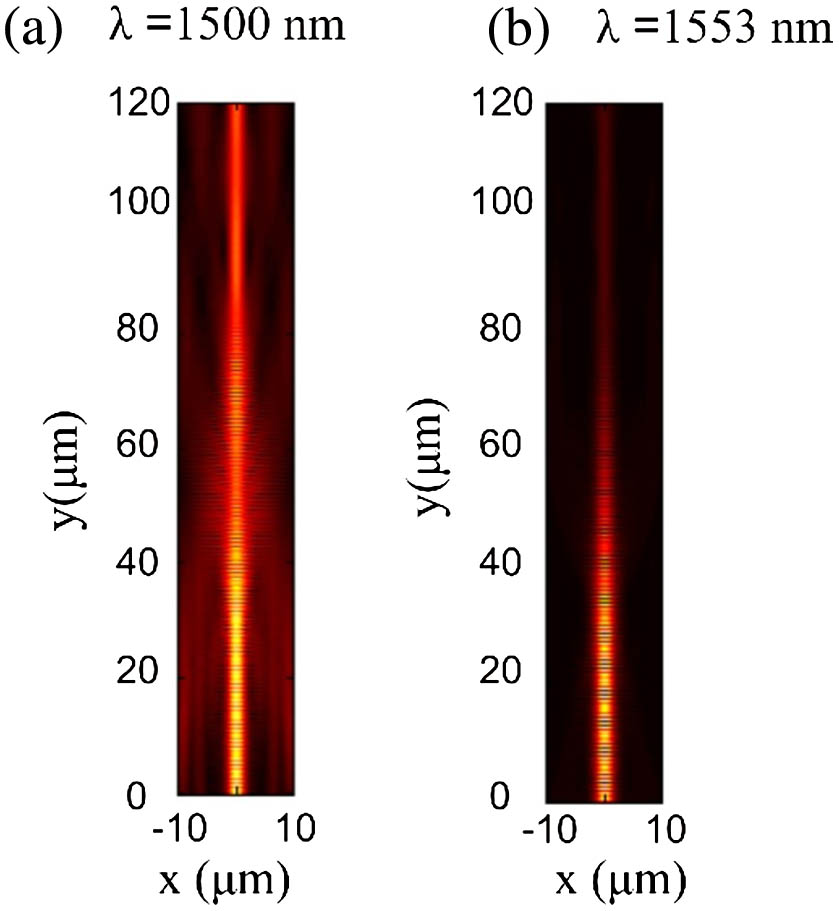
    Fig. 2. Simulations using CST Microwave Studio, FDTD method. (a) Field amplitude distribution over the waveguide at a wavelength of λ=1500  nm, (b) field amplitude distribution over the waveguide at the Bragg wavelength λ=1553  nm.
    Near-field images acquired by MH-SNOM at the Bragg wavelength λ=1553 nm. (a) Field amplitude distribution over the waveguide grating; (b) cross section of the field amplitude in the y direction, along the waveguide; (c) high-resolution amplitude scan in the area indicated by the black rectangle in (a); (d) cross section of the field amplitude in the y direction of (c); (e) measured corresponding phase plot representing a standing wave generated by the interference of the incident and the backreflected BSW mode.
    Fig. 3. Near-field images acquired by MH-SNOM at the Bragg wavelength λ=1553  nm. (a) Field amplitude distribution over the waveguide grating; (b) cross section of the field amplitude in the y direction, along the waveguide; (c) high-resolution amplitude scan in the area indicated by the black rectangle in (a); (d) cross section of the field amplitude in the y direction of (c); (e) measured corresponding phase plot representing a standing wave generated by the interference of the incident and the backreflected BSW mode.
    Fourier spectrum computed on the complex field amplitude of the interference fringes [in Fig. 3(c)] at the Bragg wavelength λ=1553 nm. The peaks corresponds to the wavenumbers (fs) of two counterpropagating BSWs.
    Fig. 4. Fourier spectrum computed on the complex field amplitude of the interference fringes [in Fig. 3(c)] at the Bragg wavelength λ=1553  nm. The peaks corresponds to the wavenumbers (fs) of two counterpropagating BSWs.
    Near-field images acquired by MH-SNOM at a wavelength of λ=1500 nm. (a) Field amplitude distribution over the waveguide grating; (b) cross section of the field amplitude in the y direction along the waveguide; (c) high-resolution amplitude scan in the area indicated by the black rectangle in (a); (d) cross section of the field amplitude in the y direction of (c); (e) phase plot showing propagating plane wave behavior that indicates very weak reflection at 1500 nm.
    Fig. 5. Near-field images acquired by MH-SNOM at a wavelength of λ=1500  nm. (a) Field amplitude distribution over the waveguide grating; (b) cross section of the field amplitude in the y direction along the waveguide; (c) high-resolution amplitude scan in the area indicated by the black rectangle in (a); (d) cross section of the field amplitude in the y direction of (c); (e) phase plot showing propagating plane wave behavior that indicates very weak reflection at 1500 nm.
    R. Dubey, B. Vosoughi Lahijani, M. H?yrinen, M. Roussey, M. Kuittinen, H. P. Herzig. Ultra-thin Bloch-surface-wave-based reflector at telecommunication wavelength[J]. Photonics Research, 2017, 5(5): 494
    Download Citation