
Yichun Jiang, Weida Zhan, Depeng Zhu. Low-Illuminance Image Processing Based on Brightness Channel Detail Enhancement[J]. Laser & Optoelectronics Progress, 2021, 58(4): 0410001
- Laser & Optoelectronics Progress
- Vol. 58, Issue 4, 0410001 (2021)
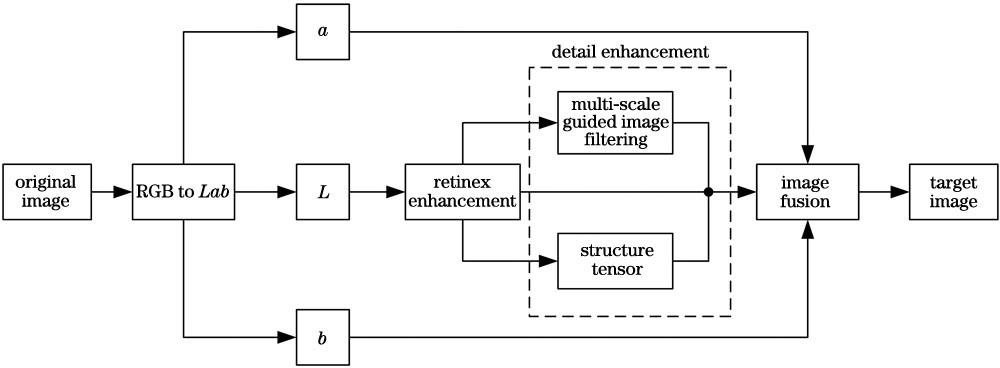
Fig. 1. Flow chart of proposed algorithm
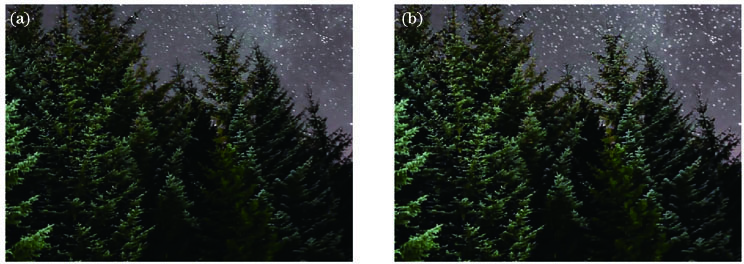
Fig. 2. Contrast before and after details enhancement. (a) Before processing; (b)after processing
Fig. 3. Comparison of the enhancement effects of various algorithms in scene1.(a) Original image; (b) MSR; (c) ALTM; (d) MF; (e) Ref. [14] algorithm; (f) proposed algorithm
Fig. 4. Comparison of the enhancement effects of various algorithms in scene2. (a) Original image; (b)MSR; (c) ALTM; (d) MF; (e) Ref. [14] algorithm; (f) proposed algorithm
Fig. 5. Comparison of the enhancement effects of various algorithms in scene3. (a) Original image; (b) MSR; (c) ALTM; (d) MF; (e) Ref. [14] algorithm; (f) proposed algorithm
Fig. 6. Comparison of the enhancement effects of various algorithms in scene4. (a) Original image; (b) MSR; (c) ALTM; (d) MF; (e) Ref. [14] algorithm; (f) proposed algorithm
Fig. 7. Comparison of the enhancement effects of various algorithms in scene5. (a) Original image; (b) MSR; (c) ALTM; (d) MF; (e) Ref. [14] algorithm; (f) proposed algorithm
|
Table 1. Selection of parameters for comparison algorithms
|
Table 2. Quantitative evaluation table of LOE
|
Table 3. Quantitative evaluation table of entropy
|
Table 4. Quantitative evaluation table of gradient energy

Set citation alerts for the article
Please enter your email address
© Copyright 2018-2021 | Chinese Laser Press. All Rights Reserved 沪ICP备15018463号-20