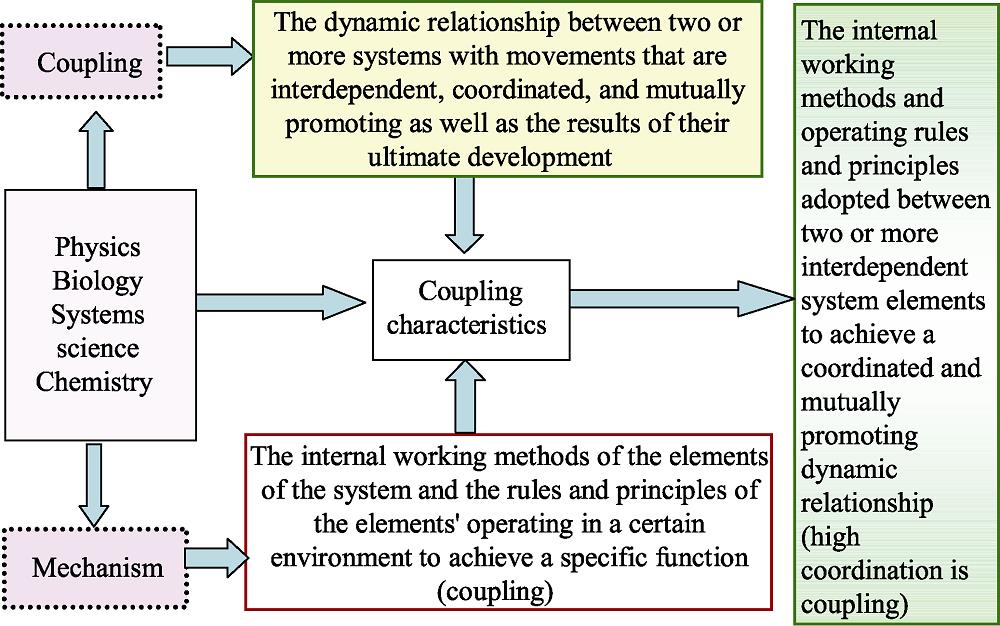
| Coupler module name | Number of coupler variables | Coupler variable names |
|---|
| Water | 41 | 12 water consumption indicators (total water demand, industrial water demand, domestic water demand, agricultural water demand, ecological water demand, total water supply, recycled water use, seawater desalination, allocated water resources, local water supply, local water resources, gap between supply and demand); 16 structural indicators of water use (rural domestic water demand, urban domestic water demand, livestock water demand, large livestock water demand, number of large livestock, small livestock water demand, number of small livestock, water demand for irrigation, irrigated area, forestry water demand, grassland water demand, fishery water demand, surface water supply, surface water resources, groundwater supply, groundwater resources); 13 quota/coefficient indicators (water consumption per 10,000 yuan industrial value added, per capita rural domestic water consumption, per capita urban domestic water consumption, large livestock water requirement quota, small livestock water requirement quota, effective irrigation coefficient, irrigation quota, forestry water requirement quota, pasture water requirement quota, fishery water requirement quota, recycled water rate, surface water extraction rate, groundwater extraction rate) | | Economy | 21 | 9 economic totals/structure indicators (GDP, value added of primary industry, value added of secondary industry, value added of tertiary industry, total retail sales of consumer goods, total fiscal revenue, total imports and exports, value added of industry, total fixed-asset investment); 6 economic averages/coefficient indicators (GDP per capita, contribution of scientific and technological progress to economic growth, impact of actual use of foreign capital, GDP conversion into fiscal income coefficient, economic openness, and proportion of industrial added value); 6 economic growth indicators (increment in primary industry, growth rate of primary industry, increment in secondary industry, growth rate of secondary industry, increment in tertiary industry, growth rate of tertiary industry) | | Society | 9 | 3 indicators of per capita income of residents (national per capita disposable income, urban per capita disposable income, rural per capita disposable income); 4 resident income growth indicators (urban per capita disposable income increment, urban per capita disposable income growth coefficient, rural per capita disposable income increment, rural per capita disposable income growth coefficient); 2 social development indicators (number of mobile phones, number of Internet users) | | Population | 23 | 5 population totals/structure indicators (total population, urban population, level of urbanization, rural population, population density); 10 population change indicators (population growth, migrant population, population migration rate, number of births, population birth rate, population reduction, emigration, emigration rate, number of deaths, mortality rate); 8 employment indicators (employed population, employment-to-population coefficient, population employed in primary industry, primary industry employment-to-population coefficient, population employed in secondary industry, secondary industry employment-to-population coefficient, population employed in tertiary industry, tertiary industry employment-to-population coefficient) | | Construction Land | 28 | 7 construction land indicators (urban and rural construction land area, urban construction land area, urban per capita construction land area, rural residential construction land area, rural per capita construction land area, transportation, industry, mining and other construction land area, highway mileage); 6 construction land change indicators (urban area increase, urban area decrease, rural residential area increase, rural residential area decrease, transportation, industry and mining area increase, transportation, industry and mining area decrease); 15 land type conversion indicators (urban area converted to forest, urban area converted to grassland, urban area converted to unused land, urban area converted to water area, urban area converted to cultivated land, rural settlement converted to forest area, rural settlement area converted to grassland, rural settlement area converted to unused land, rural residential area converted to water area, rural residential area converted to arable land, transportation, industry and mining area converted to forest, transportation, industry and mining area converted to grassland, transportation, industry and mining area converted to unused land, transportation, industry and mining area converted to water area, transportation, industry and mining area converted to arable land) | | Arable Land | 11 | 2 arable land/land indicators (arable land area, total land area); 2 arable land change indicators (arable land area increase, arable land area decrease); 7 land type conversion indicators (arable land to forest land area, arable land to grassland area, conversion of arable land to unused land area, conversion of cultivated land to water area, conversion of cultivated land to urban area, conversion of cultivated land to rural residential area, conversion of cultivated land to transportation, industry and mining area) | | Ecology | 38 | 13 ecological land/ecosystem service indicators (ecological land area, forest area, grassland area, unused land area, water area, forest land ecological service value, forest land ecological service value coefficient, grassland ecological service value coefficient, grassland ecological service value coefficient, unused land ecological service value, unused land ecological service value coefficient, water area ecological service value, water area ecological service value coefficient); 8 indicators of ecological land change (forest land area increase, forest land area decrease, grassland area increase, grassland area decrease, unused land area increase, unused land area decrease, water area increase, water area decrease); 17 land type conversion indicators (conversion of forest to urban area, conversion of forest to rural settlement area, conversion of forest to transportation, industry and mining land area, conversion of forest to arable land area, conversion of grassland to urban area, conversion of grassland to rural residential area, conversion of grassland to transportation, industry and mining area, conversion of grassland to arable land area, conversion of unused land to urban area, conversion of unused land to rural residential area, conversion of unused land to transport, industry and mining area, conversion of unprofitable land to arable land area, conversion of water to urban area, conversion of water to rural residential area, conversion of water to transportation, industry and mining area, conversion of water to arable land area) | | Pollution | 20 | 11 “three wastes”/environmental indicators (total waste water, industrial waste water discharge, domestic waste water discharge, industrial waste gas emission, solid waste generated, industrial solid waste generated, domestic waste generated, urban domestic waste generated, rural domestic waste generated, per capita domestic waste generated, PM2.5 concentration); 4 environmental treatment efficiency indicators (industrial wastewater treatment rate, domestic wastewater treatment rate, comprehensive industrial solid waste treatment volume, industrial solid waste synthesis treatment rate); 5 pollution emission intensity indicators (industrial wastewater discharge coefficient, exhaust gas emissions per 10,000 yuan of industrial value added, waste generated per 10,000 yuan of industrial value added, industrial SO2 emissions, industrial SO2 emissions ratio coefficient) | | Energy | 10 | 4 energy consumption indicators (energy consumption, industrial energy consumption, domestic energy consumption, total carbon emissions); 6 average energy consumption indicators (energy consumption per unit of industrial value added, energy consumption elasticity coefficient, per capita domestic energy consumption, energy consumption per capita, energy consumption per unit of GDP, carbon emissions per 10,000 yuan of GDP) | | 9 | 201 | 201 |
|