• Laser & Optoelectronics Progress
  • Vol. 56, Issue 9, 091701 (2019)
Ying Ji1、*, Shuang Fu2, Zhaohe Tao1, Minjie Liang1, and Yawei Wang1
Author Affiliations
  • 1 Faculty of Science, Jiangsu University, Zhenjiang, Jiangsu 212013, China
  • 2 School of Mechanical Engineering, Jiangsu University, Zhenjiang, Jiangsu 212013, China
  • show less
    DOI: 10.3788/LOP56.091701 Cite this Article Set citation alerts
    Ying Ji, Shuang Fu, Zhaohe Tao, Minjie Liang, Yawei Wang. Biological Cell Phase Imaging System Integrated with Optical Scattering Information[J]. Laser & Optoelectronics Progress, 2019, 56(9): 091701 Copy Citation Text show less
    Schematic of biological cell phase imaging system integrated with optical scattering information
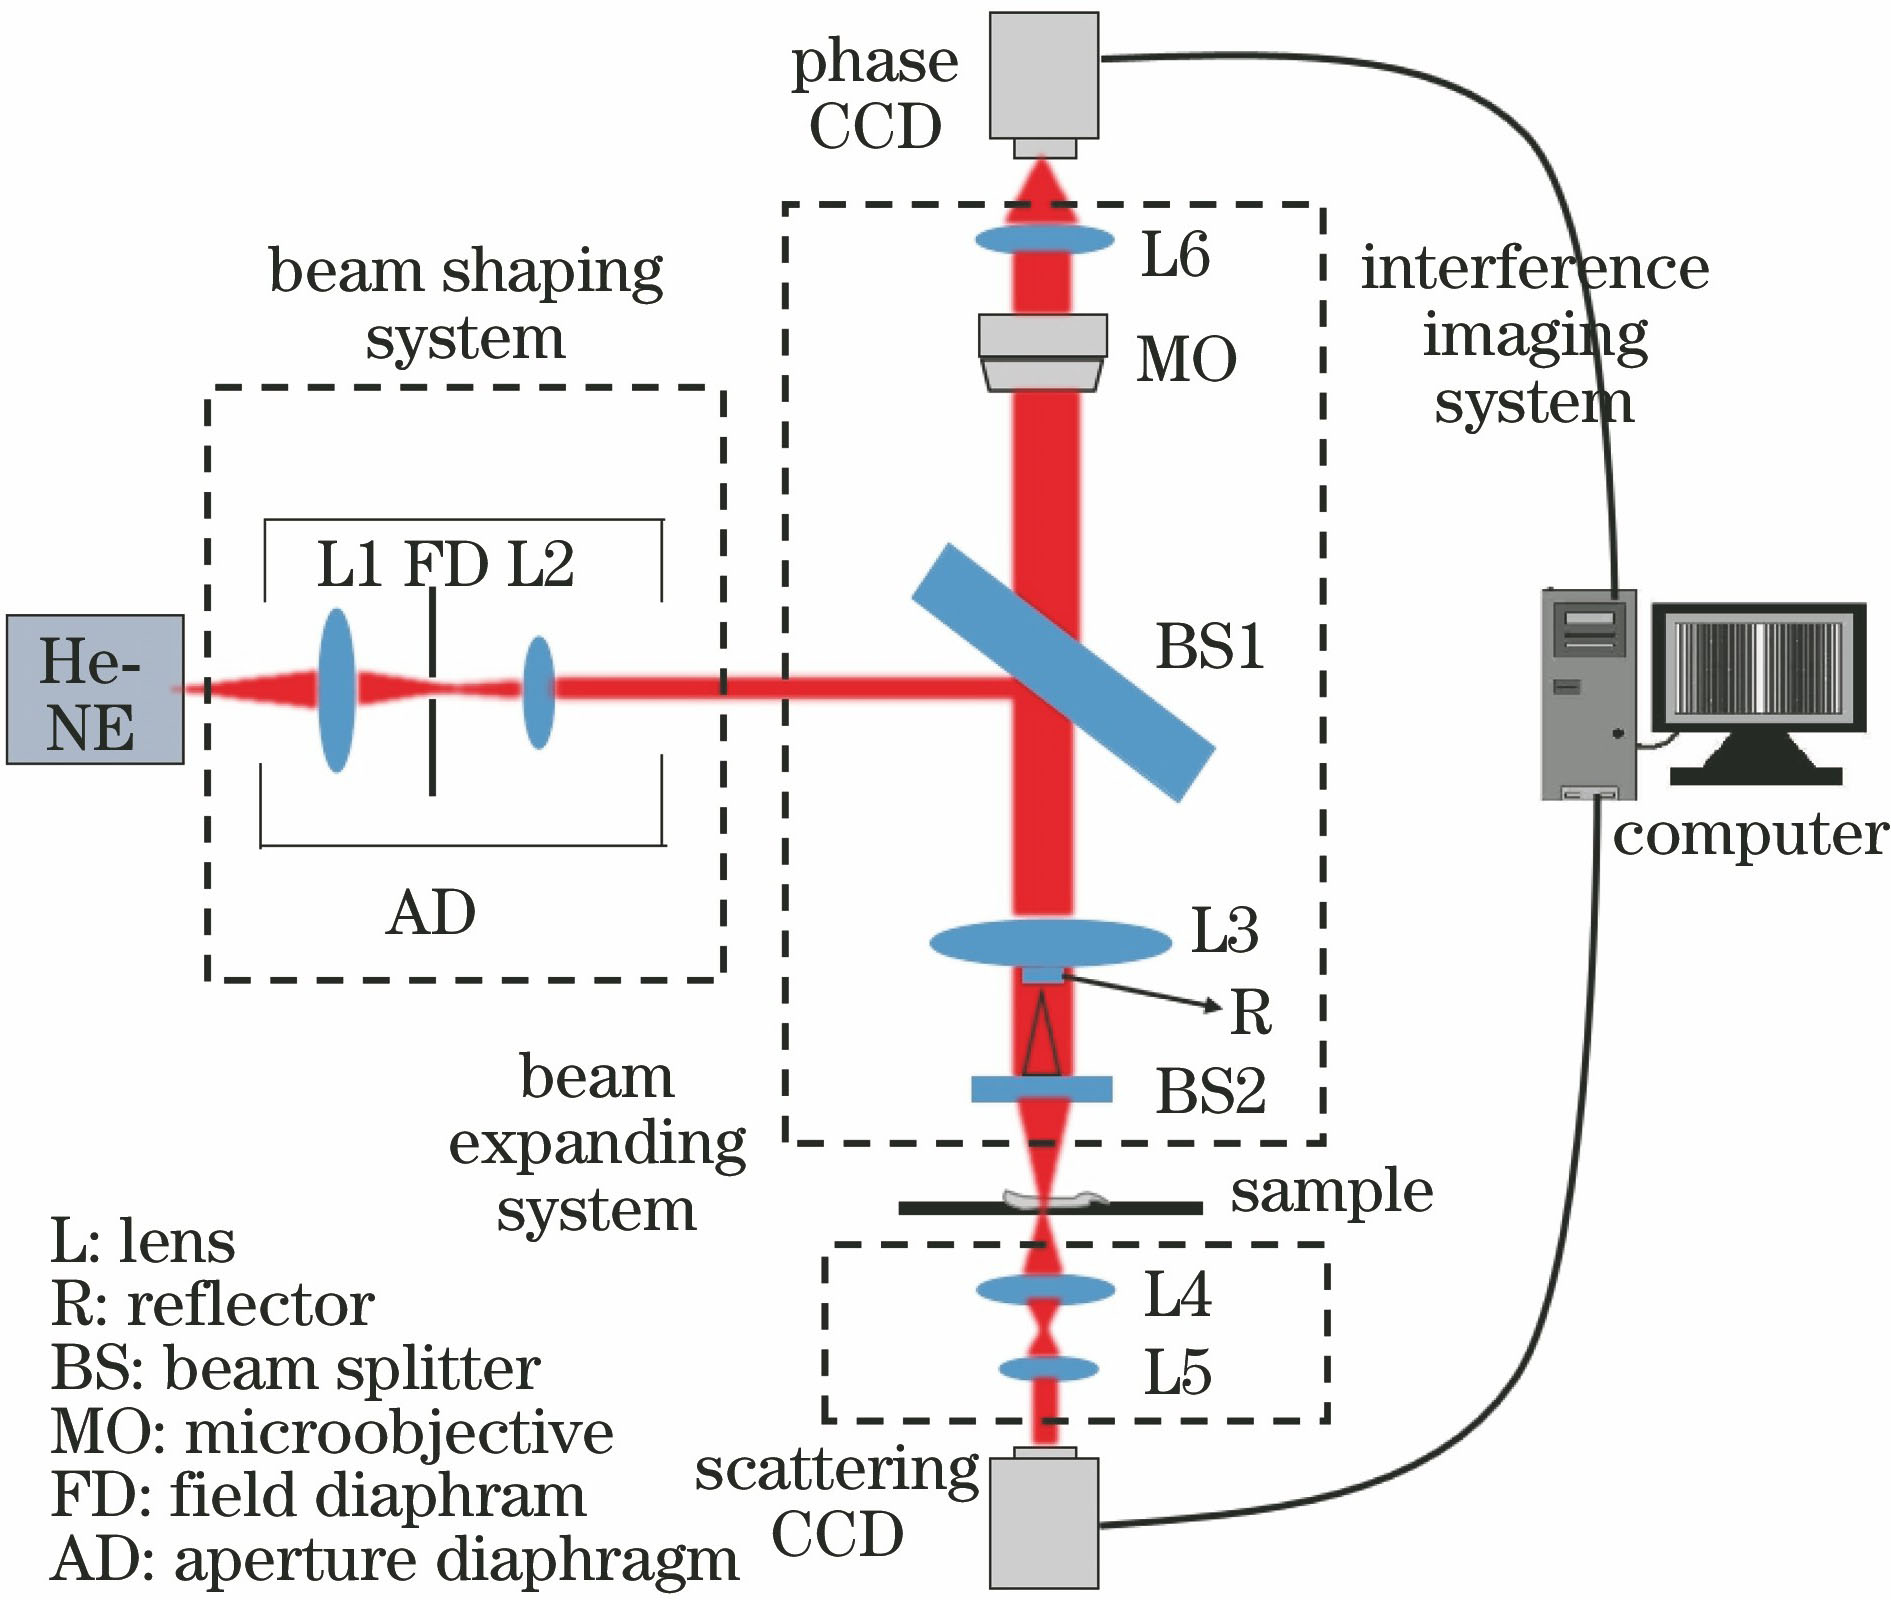
    Fig. 1. Schematic of biological cell phase imaging system integrated with optical scattering information
    Flow chart of system
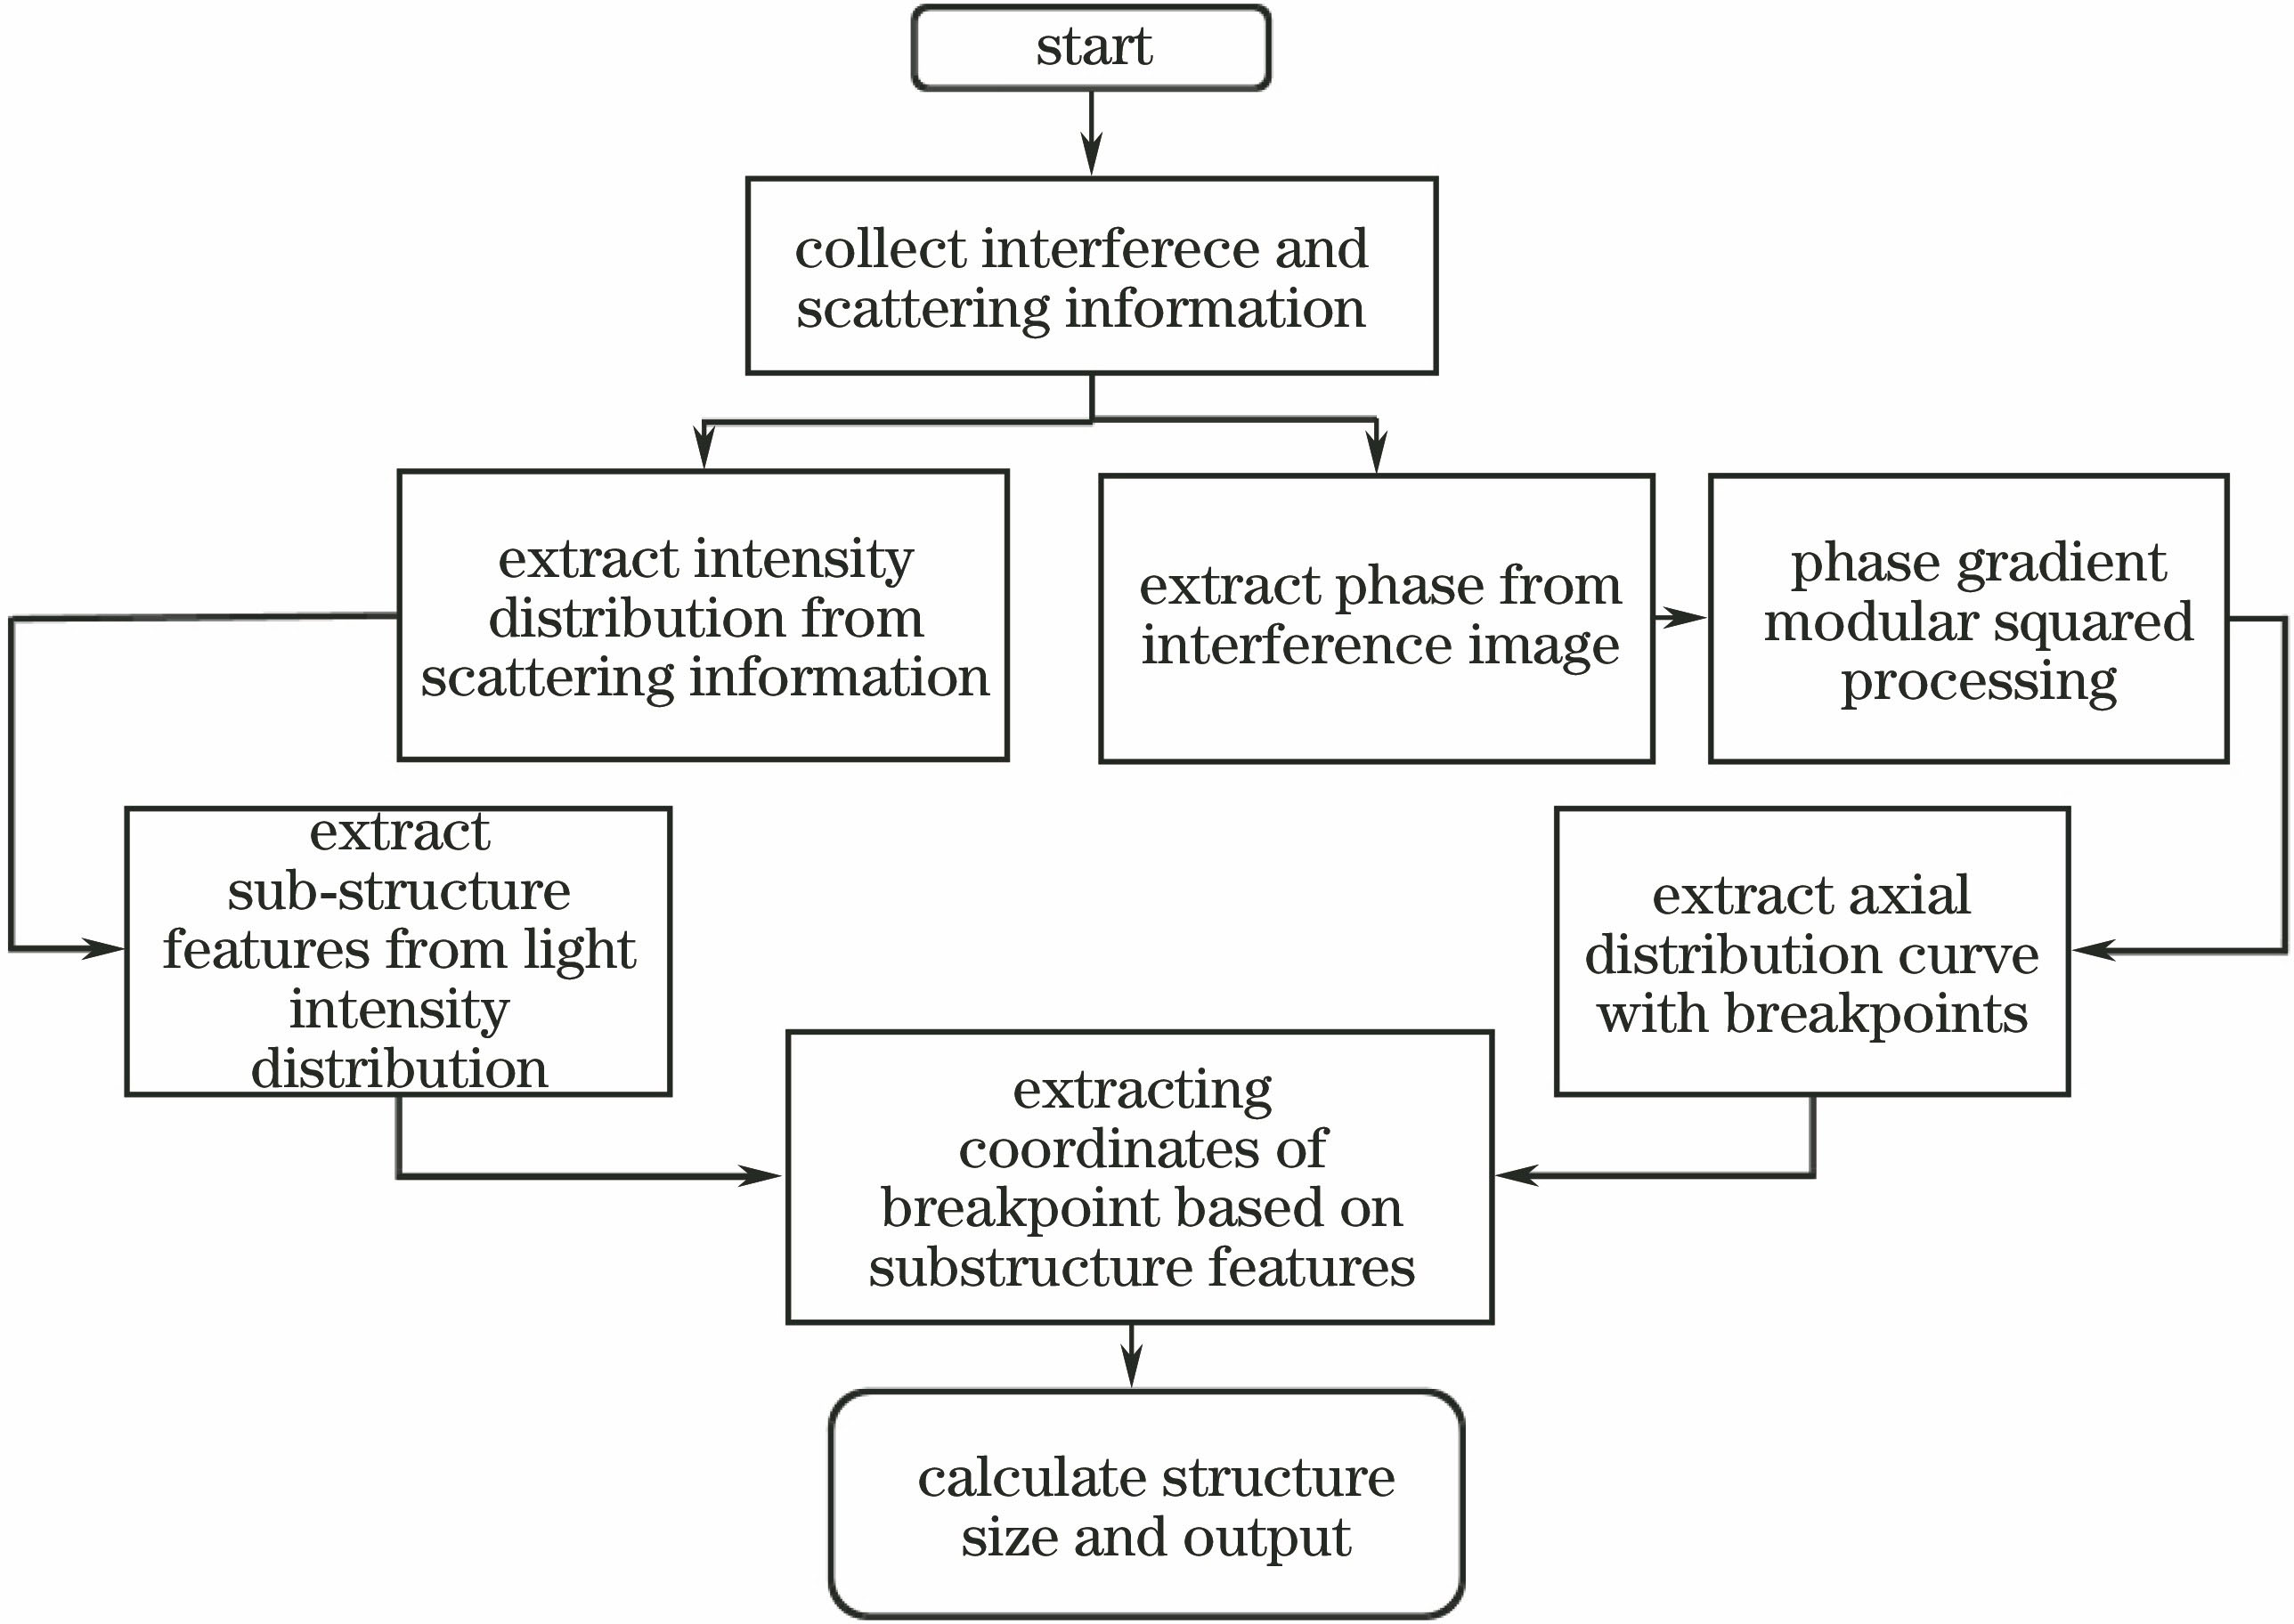
    Fig. 2. Flow chart of system
    Schematic of model. (a) Homogeneous cells; (b) monocytes; (c) binuclear cells
    Fig. 3. Schematic of model. (a) Homogeneous cells; (b) monocytes; (c) binuclear cells
    Phase distributions. (a) Homogeneous cells; (b) monocytes; (c) binuclear cells
    Fig. 4. Phase distributions. (a) Homogeneous cells; (b) monocytes; (c) binuclear cells
    Modulus square processing of phase gradient. (a) Homogeneous cells; (b) monocytes; (c) binuclear cells
    Fig. 5. Modulus square processing of phase gradient. (a) Homogeneous cells; (b) monocytes; (c) binuclear cells
    Axial distribution of modulus square of phase gradient. (a) Homogeneous cells; (b) monocytes; (c) binuclear cells
    Fig. 6. Axial distribution of modulus square of phase gradient. (a) Homogeneous cells; (b) monocytes; (c) binuclear cells
    Scattered light intensity distributions of models and diagonal distributions of scattered light intensity. (a) (d) Homogeneous cells; (b) (e) monocytes; (c) (f) binuclear cells
    Fig. 7. Scattered light intensity distributions of models and diagonal distributions of scattered light intensity. (a) (d) Homogeneous cells; (b) (e) monocytes; (c) (f) binuclear cells
    Phase information of human red blood cells. (a) Phase distribution; (b) axial distribution of modulus square of phase gradient
    Fig. 8. Phase information of human red blood cells. (a) Phase distribution; (b) axial distribution of modulus square of phase gradient
    Analysis diagram of human neutrophils. (a) Phase distribution; (b) axial distribution of modulus square of phase gradient
    Fig. 9. Analysis diagram of human neutrophils. (a) Phase distribution; (b) axial distribution of modulus square of phase gradient
    Cell typeHorizontal coordinate of break point
    HomogeneousMonocyteA(53) B(204)A(53) B(100) C(157) D(204)
    BinuclearA(53) B(100) C(112) D(145)E(157) F(204)
    Table 1. Horizontal coordinates of break points in axial distribution curve
    Cell typeDesign parameter /μm(cell diameter/nuclear diameter)Measured value /μm(cell diameter/nuclear diameter)Average error rate /%
    Homogeneous18.0017.761.33
    Monocyte18.00/7.0017.76/6.941.08
    Binuclear18.00/7.00/4.0017.77/6.71/3.882.81
    Table 2. Comparison of measured values with model parameters
    Ying Ji, Shuang Fu, Zhaohe Tao, Minjie Liang, Yawei Wang. Biological Cell Phase Imaging System Integrated with Optical Scattering Information[J]. Laser & Optoelectronics Progress, 2019, 56(9): 091701
    Download Citation