• Photonics Research
  • Vol. 10, Issue 1, 96 (2022)
Yonghao Mi1、3, Kyle Johnston1, Valentina Shumakova1, Søren H. Møller1, Kamalesh Jana1, Chunmei Zhang1, André Staudte1, Shawn Sederberg1、2、*, and Paul B. Corkum1
Author Affiliations
  • 1Joint Attosecond Science Laboratory, University of Ottawa and National Research Council Canada, Ottawa, Ontario K1N 6X1, Canada
  • 2Present address: School of Engineering Science, Simon Fraser University, Burnaby, British Columbia V5A 1S6, Canada
  • 3e-mail: ymi@uottawa.ca
  • show less
    DOI: 10.1364/PRJ.434325 Cite this Article Set citation alerts
    Yonghao Mi, Kyle Johnston, Valentina Shumakova, Søren H. Møller, Kamalesh Jana, Chunmei Zhang, André Staudte, Shawn Sederberg, Paul B. Corkum. Active stabilization of terahertz waveforms radiated from a two-color air plasma[J]. Photonics Research, 2022, 10(1): 96 Copy Citation Text show less
    (a) Schematic of the experimental setup. An ω−2ω pulse pair is focused into ambient air and a plasma channel is formed. The radiated THz waveform is collected and sampled via EOS. Two diagnostic tools enable insight into the origin of interferometric drifts between the ω and 2ω pulses: spectral interference and in situ detection of current densities generated in the plasma channel. (b) Rendering of the detector used to sample currents within the plasma channel; the detector is placed near the focal plane of the bichromatic pulses. The separation between the electrodes is approximately 1 mm and is sufficiently large that neither the optical beams nor the THz pulses are impeded by the electrodes. PCB, printed circuit board; L, focusing lens.
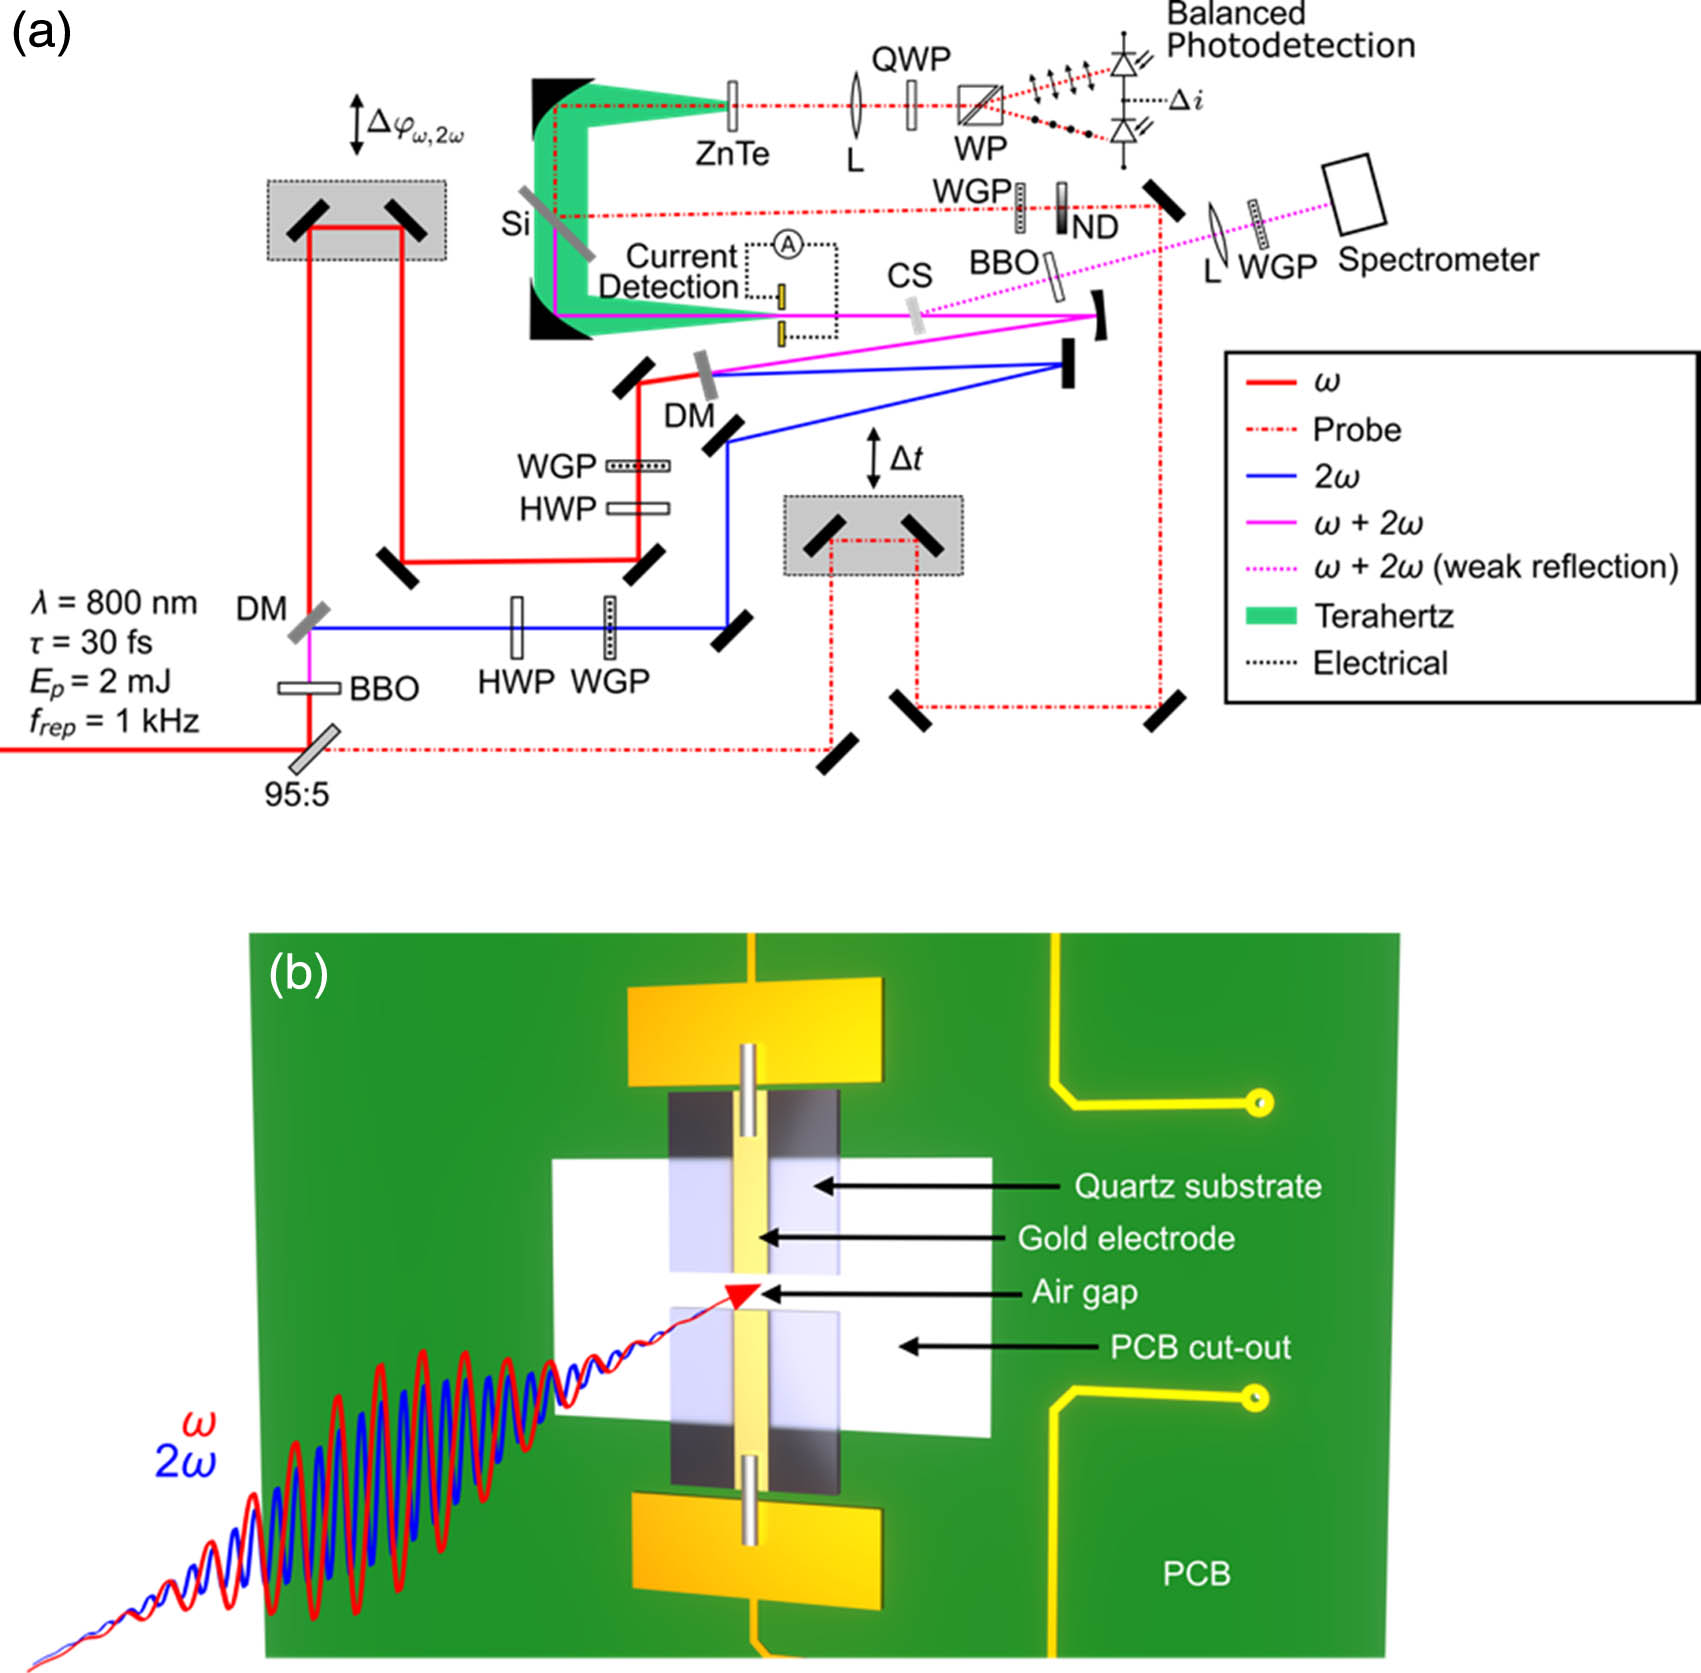
    Fig. 1. (a) Schematic of the experimental setup. An ω2ω pulse pair is focused into ambient air and a plasma channel is formed. The radiated THz waveform is collected and sampled via EOS. Two diagnostic tools enable insight into the origin of interferometric drifts between the ω and 2ω pulses: spectral interference and in situ detection of current densities generated in the plasma channel. (b) Rendering of the detector used to sample currents within the plasma channel; the detector is placed near the focal plane of the bichromatic pulses. The separation between the electrodes is approximately 1 mm and is sufficiently large that neither the optical beams nor the THz pulses are impeded by the electrodes. PCB, printed circuit board; L, focusing lens.
    Collection of THz pulses measured under ambient lab conditions, demonstrating the extreme sensitivity of the THz waveform to interferometric, laser, and environmental instabilities. The scan is repeated 20 times and the first, tenth, and twentieth waveforms are shown in (a)–(c), respectively. The normalized root mean square error between the first scan and each subsequent scan is shown in (d).
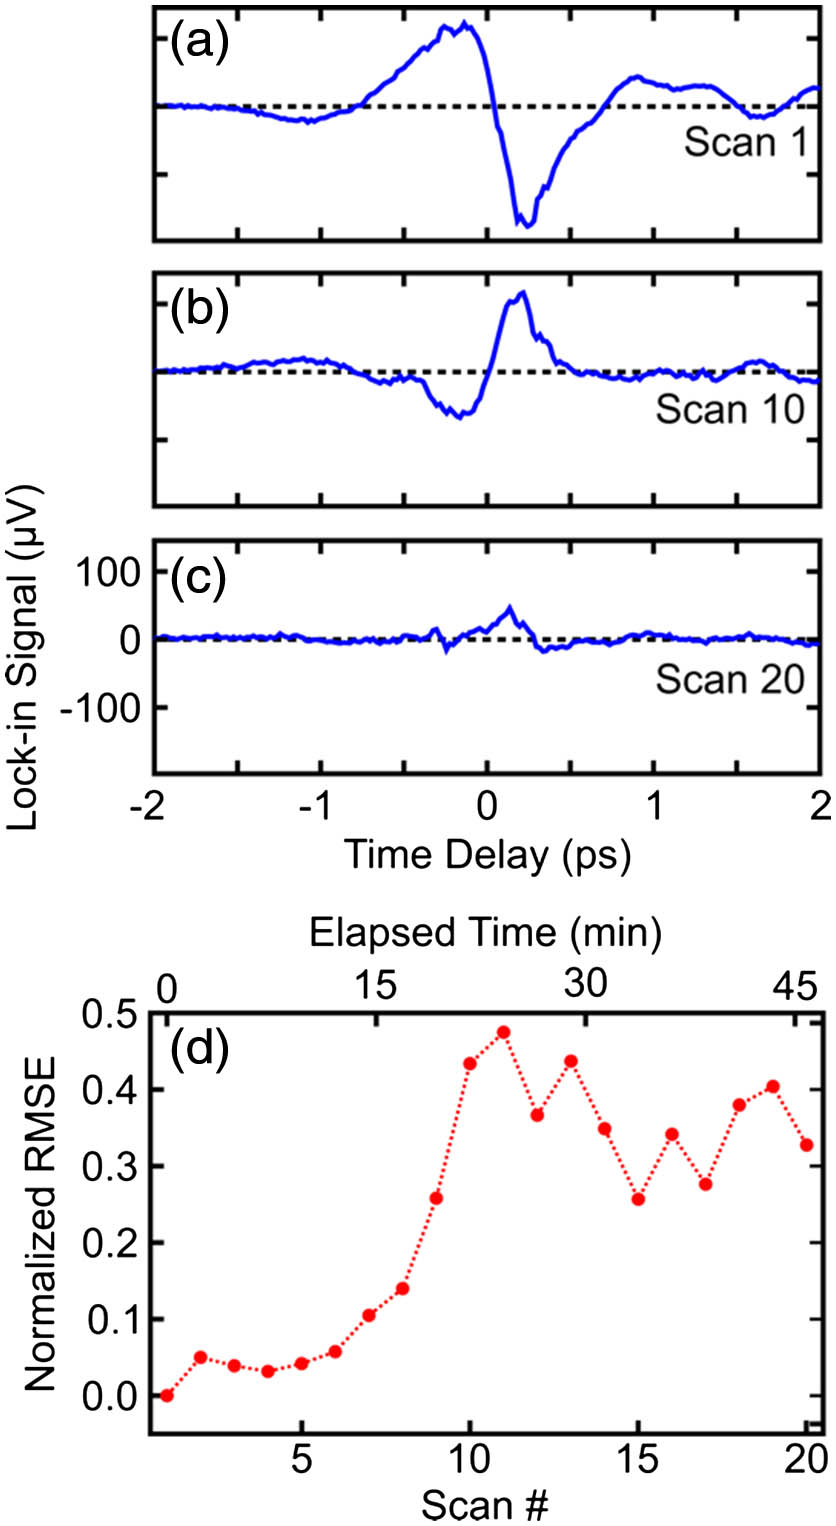
    Fig. 2. Collection of THz pulses measured under ambient lab conditions, demonstrating the extreme sensitivity of the THz waveform to interferometric, laser, and environmental instabilities. The scan is repeated 20 times and the first, tenth, and twentieth waveforms are shown in (a)–(c), respectively. The normalized root mean square error between the first scan and each subsequent scan is shown in (d).
    Phase-sensitivity correlations between the THz waveform and currents measured slightly before the center of the plasma channel. (a) Simultaneous measurements of the peak of the THz waveform (blue), the current (red), and the 2ω spectral interference signal as Δφω,2ω is adjusted. (b) The envelope functions corresponding to the THz waveform (blue) and current (red) measurement presented in (a), extracted via Hilbert transformation. The scan shown in (a) is repeated 15 times, and the data obtained from EOS, the current detector, and 2ω spectral interference are shown in (c), (d), and (e), respectively. (f) Summary of the phase correlation between the THz emission (blue), currents (red), and the spectral interference signal (green); the error between the phases of the current and the THz signal, δφcurr,EOS (cyan), and the error between the phases of the current and spectral interference signals, δφcurr,spec (magenta), are plotted using the axis on the right-hand side. The root mean square of δφcurr,EOS is calculated to be 400 mrad, whereas the root mean square of δφcurr,spec is found to be 139 mrad.
    Fig. 3. Phase-sensitivity correlations between the THz waveform and currents measured slightly before the center of the plasma channel. (a) Simultaneous measurements of the peak of the THz waveform (blue), the current (red), and the 2ω spectral interference signal as Δφω,2ω is adjusted. (b) The envelope functions corresponding to the THz waveform (blue) and current (red) measurement presented in (a), extracted via Hilbert transformation. The scan shown in (a) is repeated 15 times, and the data obtained from EOS, the current detector, and 2ω spectral interference are shown in (c), (d), and (e), respectively. (f) Summary of the phase correlation between the THz emission (blue), currents (red), and the spectral interference signal (green); the error between the phases of the current and the THz signal, δφcurr,EOS (cyan), and the error between the phases of the current and spectral interference signals, δφcurr,spec (magenta), are plotted using the axis on the right-hand side. The root mean square of δφcurr,EOS is calculated to be 400 mrad, whereas the root mean square of δφcurr,spec is found to be 139 mrad.
    Measurement of correlations in phase sensitivity of the THz waveform and currents performed at the position in the plasma channel from which the brightest side-emitted light is observed. (a) Dependency of the peak of the THz waveform (blue) and the current (red) on Δφω,2ω, where sensitive control over the amplitude and sign of both parameters is demonstrated; (b) envelope functions of the measured data in (a), extracted via Hilbert transformation. Notably, the center of mass of the EOS envelope is advanced in phase by approximately 13.4 rad with respect to the center of mass of the current envelope. This shift is a direct consequence of plasma dispersion within the plasma channel. Only a portion of this plasma dispersion is experienced by the time pulses arriving at the current detector, whereas THz emission continues at subsequent positions along the plasma channel. (c) Summary of the phase correlation between currents and THz emission. The phase of the oscillating current (red) and THz emission (blue) is extracted from each scan for Δφω,2ω=−12.8 rad, where a constant offset between the two parameters is removed. The error between these two parameters is shown by the green curve, which has a root mean square error of 57.1 mrad.
    Fig. 4. Measurement of correlations in phase sensitivity of the THz waveform and currents performed at the position in the plasma channel from which the brightest side-emitted light is observed. (a) Dependency of the peak of the THz waveform (blue) and the current (red) on Δφω,2ω, where sensitive control over the amplitude and sign of both parameters is demonstrated; (b) envelope functions of the measured data in (a), extracted via Hilbert transformation. Notably, the center of mass of the EOS envelope is advanced in phase by approximately 13.4 rad with respect to the center of mass of the current envelope. This shift is a direct consequence of plasma dispersion within the plasma channel. Only a portion of this plasma dispersion is experienced by the time pulses arriving at the current detector, whereas THz emission continues at subsequent positions along the plasma channel. (c) Summary of the phase correlation between currents and THz emission. The phase of the oscillating current (red) and THz emission (blue) is extracted from each scan for Δφω,2ω=12.8  rad, where a constant offset between the two parameters is removed. The error between these two parameters is shown by the green curve, which has a root mean square error of 57.1 mrad.
    THz waveform stabilization. (a) Schematic of the current detection and feedback scheme. The average of 40 scans of the stabilized THz waveform is shown by the solid line in (b), and the 1−σ standard deviation is depicted by the shaded regions. (c) The normalized root mean square error of each scan with respect to the first scan.
    Fig. 5. THz waveform stabilization. (a) Schematic of the current detection and feedback scheme. The average of 40 scans of the stabilized THz waveform is shown by the solid line in (b), and the 1σ standard deviation is depicted by the shaded regions. (c) The normalized root mean square error of each scan with respect to the first scan.
    Yonghao Mi, Kyle Johnston, Valentina Shumakova, Søren H. Møller, Kamalesh Jana, Chunmei Zhang, André Staudte, Shawn Sederberg, Paul B. Corkum. Active stabilization of terahertz waveforms radiated from a two-color air plasma[J]. Photonics Research, 2022, 10(1): 96
    Download Citation