• Spectroscopy and Spectral Analysis
  • Vol. 41, Issue 7, 2050 (2021)
Chun-mei YU*, Nan ZHANG, and Hai-peng TENG
Author Affiliations
  • School of Metallurgical and Ecological Engineering, University of Science and Technology Beijing, Beijing 100083, China
  • show less
    DOI: 10.3964/j.issn.1000-0593(2021)07-2050-07 Cite this Article
    Chun-mei YU, Nan ZHANG, Hai-peng TENG. Investigation of Different Structures of Coals Through FTIR and Raman Techniques[J]. Spectroscopy and Spectral Analysis, 2021, 41(7): 2050 Copy Citation Text show less
    The infrared spectra of the coal marked at the main peak position after baseline correction(a): 2 000~400 cm-1; (b): 3 600~2 500 cm-1
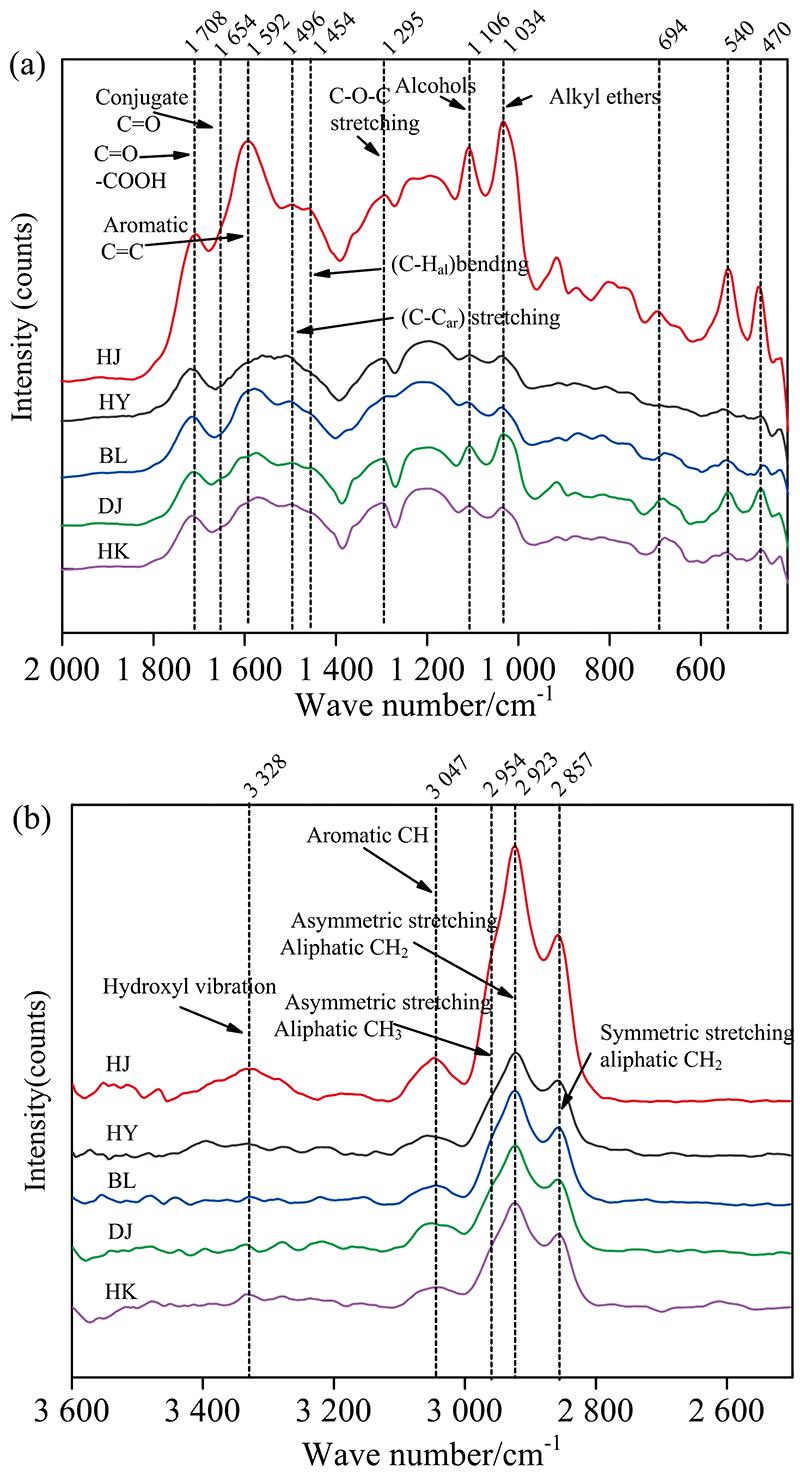
    Fig. 1. The infrared spectra of the coal marked at the main peak position after baseline correction
    (a): 2 000~400 cm-1; (b): 3 600~2 500 cm-1
    Relationship between H/C ratio and parameters obtained from FTIR calculation(a): Apparent aromaticity fa(FTIR)vs H/C ratio; (b): (R/C)uvs H/C ratio; (c): Hal/H and Aar/Aalvs H/C ratio
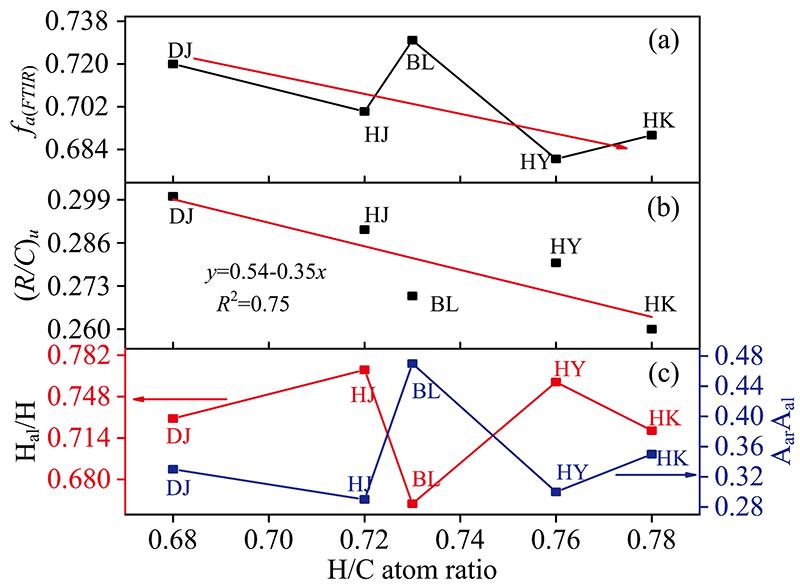
    Fig. 2. Relationship between H/C ratio and parameters obtained from FTIR calculation
    (a): Apparent aromaticity fa(FTIR)vs H/C ratio; (b): (R/C)uvs H/C ratio; (c): Hal/H and Aar/Aalvs H/C ratio
    Curve-fitted FTIR spectra of the aliphatic C—H stretching vibrational band in range of 3 000 to 2 800 cm-1
    Fig. 3. Curve-fitted FTIR spectra of the aliphatic C—H stretching vibrational band in range of 3 000 to 2 800 cm-1
    Relationship between CH2/CH3 values and H/C atomic ratios
    Fig. 4. Relationship between CH2/CH3 values and H/C atomic ratios
    Curve-fitted FTIR spectra of the aliphatic C—H stretching vibrational band in range of 900 to 730 cm-1
    Fig. 5. Curve-fitted FTIR spectra of the aliphatic C—H stretching vibrational band in range of 900 to 730 cm-1
    Spectral decomposition results of coal samples with 10 bands method
    Fig. 6. Spectral decomposition results of coal samples with 10 bands method
    Relationship between H/C atomic ratios and parameters obtained from Raman spectra(a): Area ratio of each peak and H/C atomic ratio; (b): Different peak area ratio and H/C atomic ratio; (c): Main peak FWHM and H/C atomic ratio
    Fig. 7. Relationship between H/C atomic ratios and parameters obtained from Raman spectra
    (a): Area ratio of each peak and H/C atomic ratio; (b): Different peak area ratio and H/C atomic ratio; (c): Main peak FWHM and H/C atomic ratio
    Simple coal structure model using Raman and infrared analysis
    Fig. 8. Simple coal structure model using Raman and infrared analysis
    样品HYHJBLDJHK
    工业分析
    /Wt%
    Ad6.0810.345.7411.127.17
    Vd33.7431.2533.8533.0834.79
    FCd60.1858.4160.4155.8058.05
    元素分析
    /Wt%
    Cd70.6867.2873.7966.9366.05
    Hd4.504.024.463.794.32
    Od17.4817.1614.8916.7320.77
    Nd0.800.710.840.730.70
    Sd0.460.490.280.700.99
    H/C原子比0.760.720.730.680.78
    O/C原子比0.190.190.150.190.24
    Table 1. Proximate and ultimate analysis of different samples
    序号位置/cm-1官能团
    13 419~3 359O—H或N—H伸缩振动
    23 080~3 035芳香环C—H伸缩振动
    32 975~2 955脂肪族CH3反对称伸缩振动
    42 925~2 919脂肪族CH2反对称伸缩振动
    52 900脂肪族C—H反对称伸缩振动
    62 863脂肪族CH3对称伸缩振动
    72 848脂肪族CH2对称伸缩振动
    81 745~1 730脂肪族(油脂, 酸, 酮, 醛)(C=O)
    91 721~1 695芳香族(羟基, 羧基)
    101 615~1 585芳香环(C=C)
    111 500~1 450(C—C)ar伸缩
    121 460~1 450脂肪链(CH3, CH2)
    131 380对称(—CH2—)弯曲变形
    141 300~1 000酚醛(C—O—C)伸缩变形
    15900~700芳香键; (C—H)ar面外弯曲振动
    16880~860芳香环(CH), 相邻单H变形
    17849芳香环(CH), 相邻双H变形
    18776~730芳香环(CH), 相邻多H变形
    19730~720烷烃侧环[(CH2)n, n>4]
    Table 2. Band assignments for different functional groups in FTIR spectra
    名称位置/cm-1官能团键型
    GL1 690羰基(C=O)sp2
    G1 597芳香环象限呼吸; 烯烃(C=C)sp2
    GR~1 540sp2
    VL1 5003~5芳香环; 芳香环半圆形呼吸; 无定形碳结构sp2, sp3
    VR1 420sp2, sp3
    D1 372芳烃(≥6个稠化苯环, 少于石墨)sp2
    SL1 269烷基芳醚; 对位芳烃sp2, sp3
    S~1 185Caromatic—Calky; 芳香脂肪族醚; 氢化芳香族环上的C—C; 六角金刚石碳sp3; 芳香环上的C—Hsp2, sp3
    SR1 109芳香环上的C—H; 正交化二基取代苯环sp2
    R~930烷烃和环烷烃上的C—C; 芳香环上的C—Hsp2, sp3
    Table 3. Assignment of bands for Raman spectra (1 800~800 cm-1) of coals
    样品Hal/Hfa(FTIR)(R/C)uCH2/CH3Aar/Aal
    HY0.760.680.281.920.30
    HJ0.770.700.291.540.29
    BL0.660.730.271.710.47
    DJ0.730.720.301.120.33
    HK0.720.690.261.840.35
    Table 4. Structure parameters from FTIR calculation
    Chun-mei YU, Nan ZHANG, Hai-peng TENG. Investigation of Different Structures of Coals Through FTIR and Raman Techniques[J]. Spectroscopy and Spectral Analysis, 2021, 41(7): 2050
    Download Citation