• Laser & Optoelectronics Progress
  • Vol. 56, Issue 15, 153002 (2019)
Hasan Umut1、2, Sawut Mamat1、2、3、*, and Chunyue Ma1、2
Author Affiliations
  • 1 College of Resource and Environment Sciences, Xinjiang University, Urumqi, Xinjiang 830046, China
  • 2 Key Laboratory of Oasis Ecology of Ministry of Education, Urumqi, Xinjiang 830046, China
  • 3 Key Laboratory for Wisdom City and Environmental Modeling, Xinjiang University, Urumqi, Xinjiang 830046, China
  • show less
    DOI: 10.3788/LOP56.153002 Cite this Article Set citation alerts
    Hasan Umut, Sawut Mamat, Chunyue Ma. Hyperspectral Estimation of Wheat Leaf Water Content Using Fractional Differentials and Successive Projection Algorithm-Back Propagation Neural Network[J]. Laser & Optoelectronics Progress, 2019, 56(15): 153002 Copy Citation Text show less
    Canopy spectral curves of spring wheat. (a) Canopy spectral curves of spring wheat with different water contents; (b) canopy spectral curves of spring wheat with 0-order to 2-order differentials
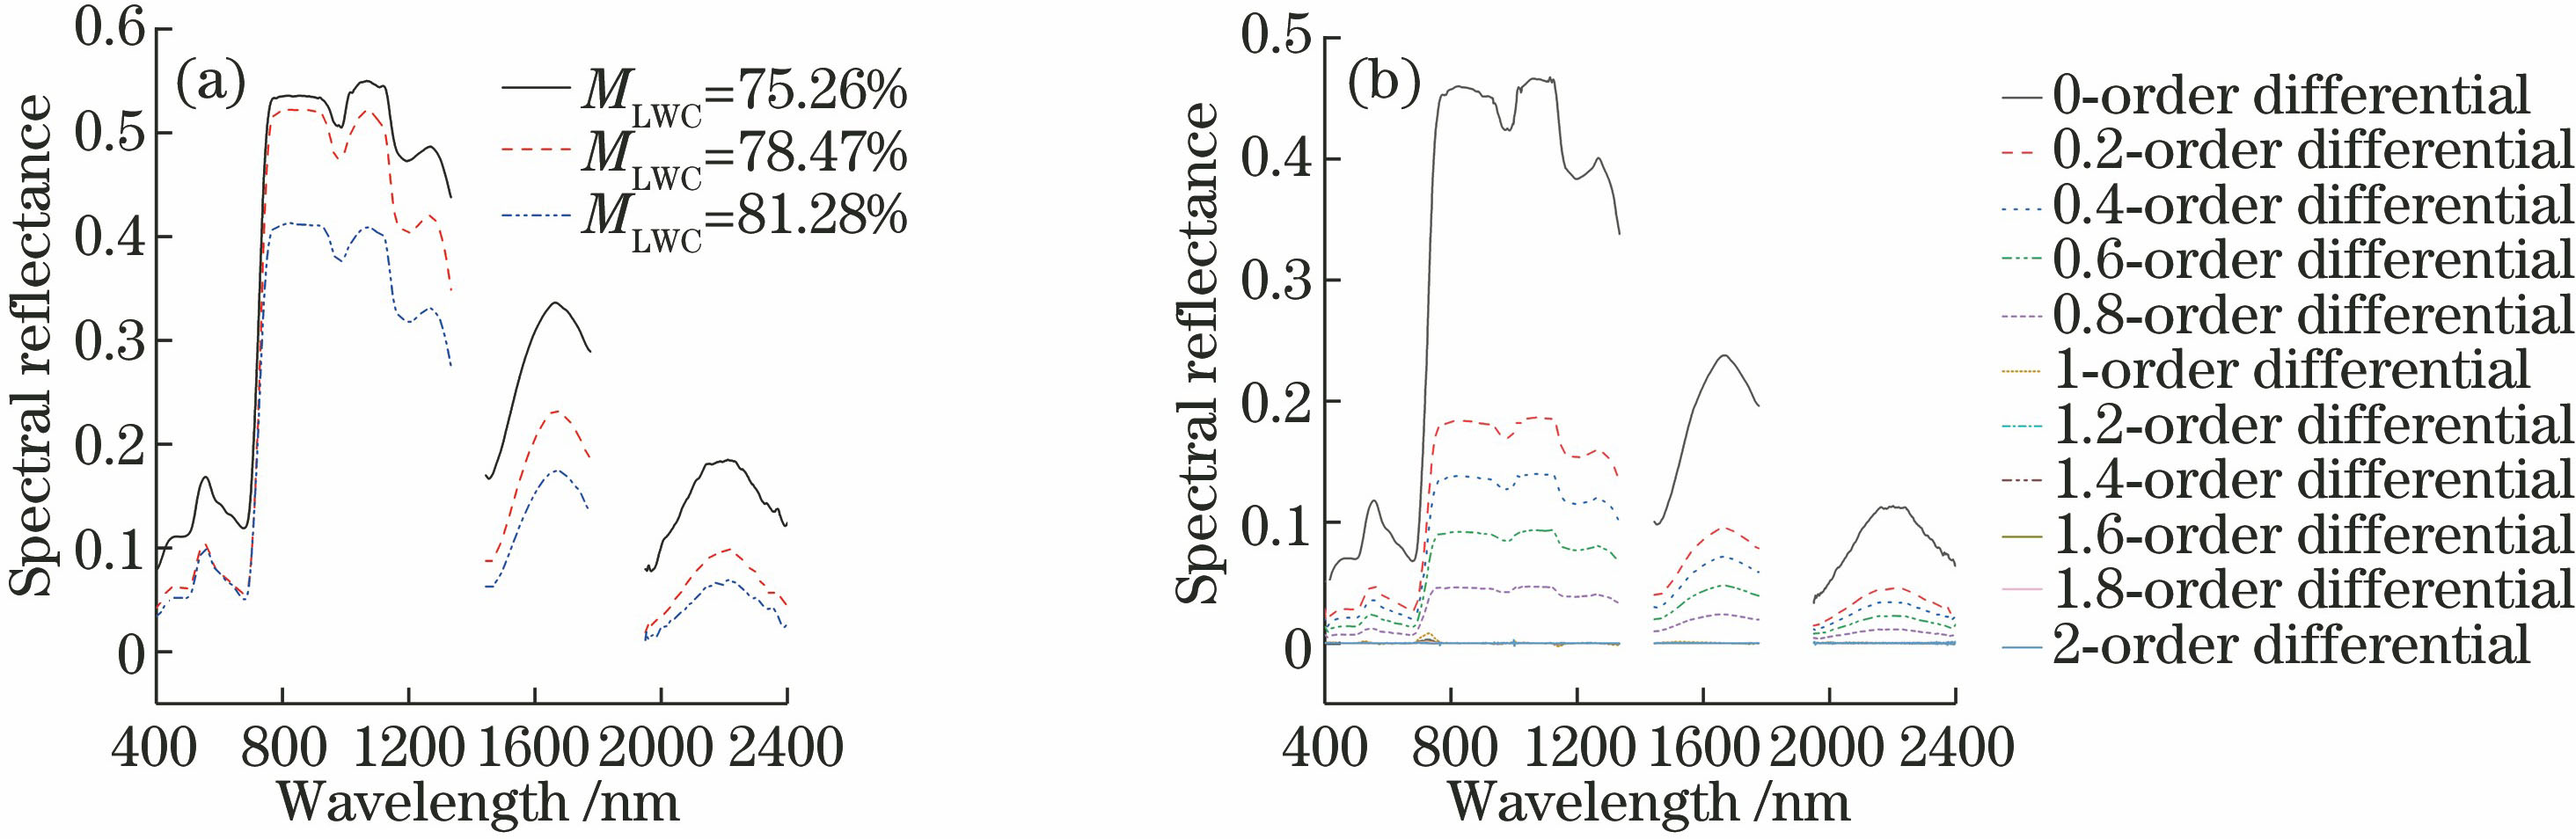
    Fig. 1. Canopy spectral curves of spring wheat. (a) Canopy spectral curves of spring wheat with different water contents; (b) canopy spectral curves of spring wheat with 0-order to 2-order differentials
    Correlation coef?cients between MLWC and spectral re?ectance. (a) Correlation coefficients between MLWC and 0-order spectrum; (b) correlation coefficients between MLWC and 0.2, 0.4, 0.6, 0.8-order spectra; (c) correlation coefficients between MLWC and 1-order spectrum; (d) correlation coefficients between MLWC and 1.2-order spectrum; (e) correlation coefficients between MLWC and 1.4-order spectrum; (f) correlation coefficients between MLWC and 1.6-order spectrum; (g) correlation coefficients bet
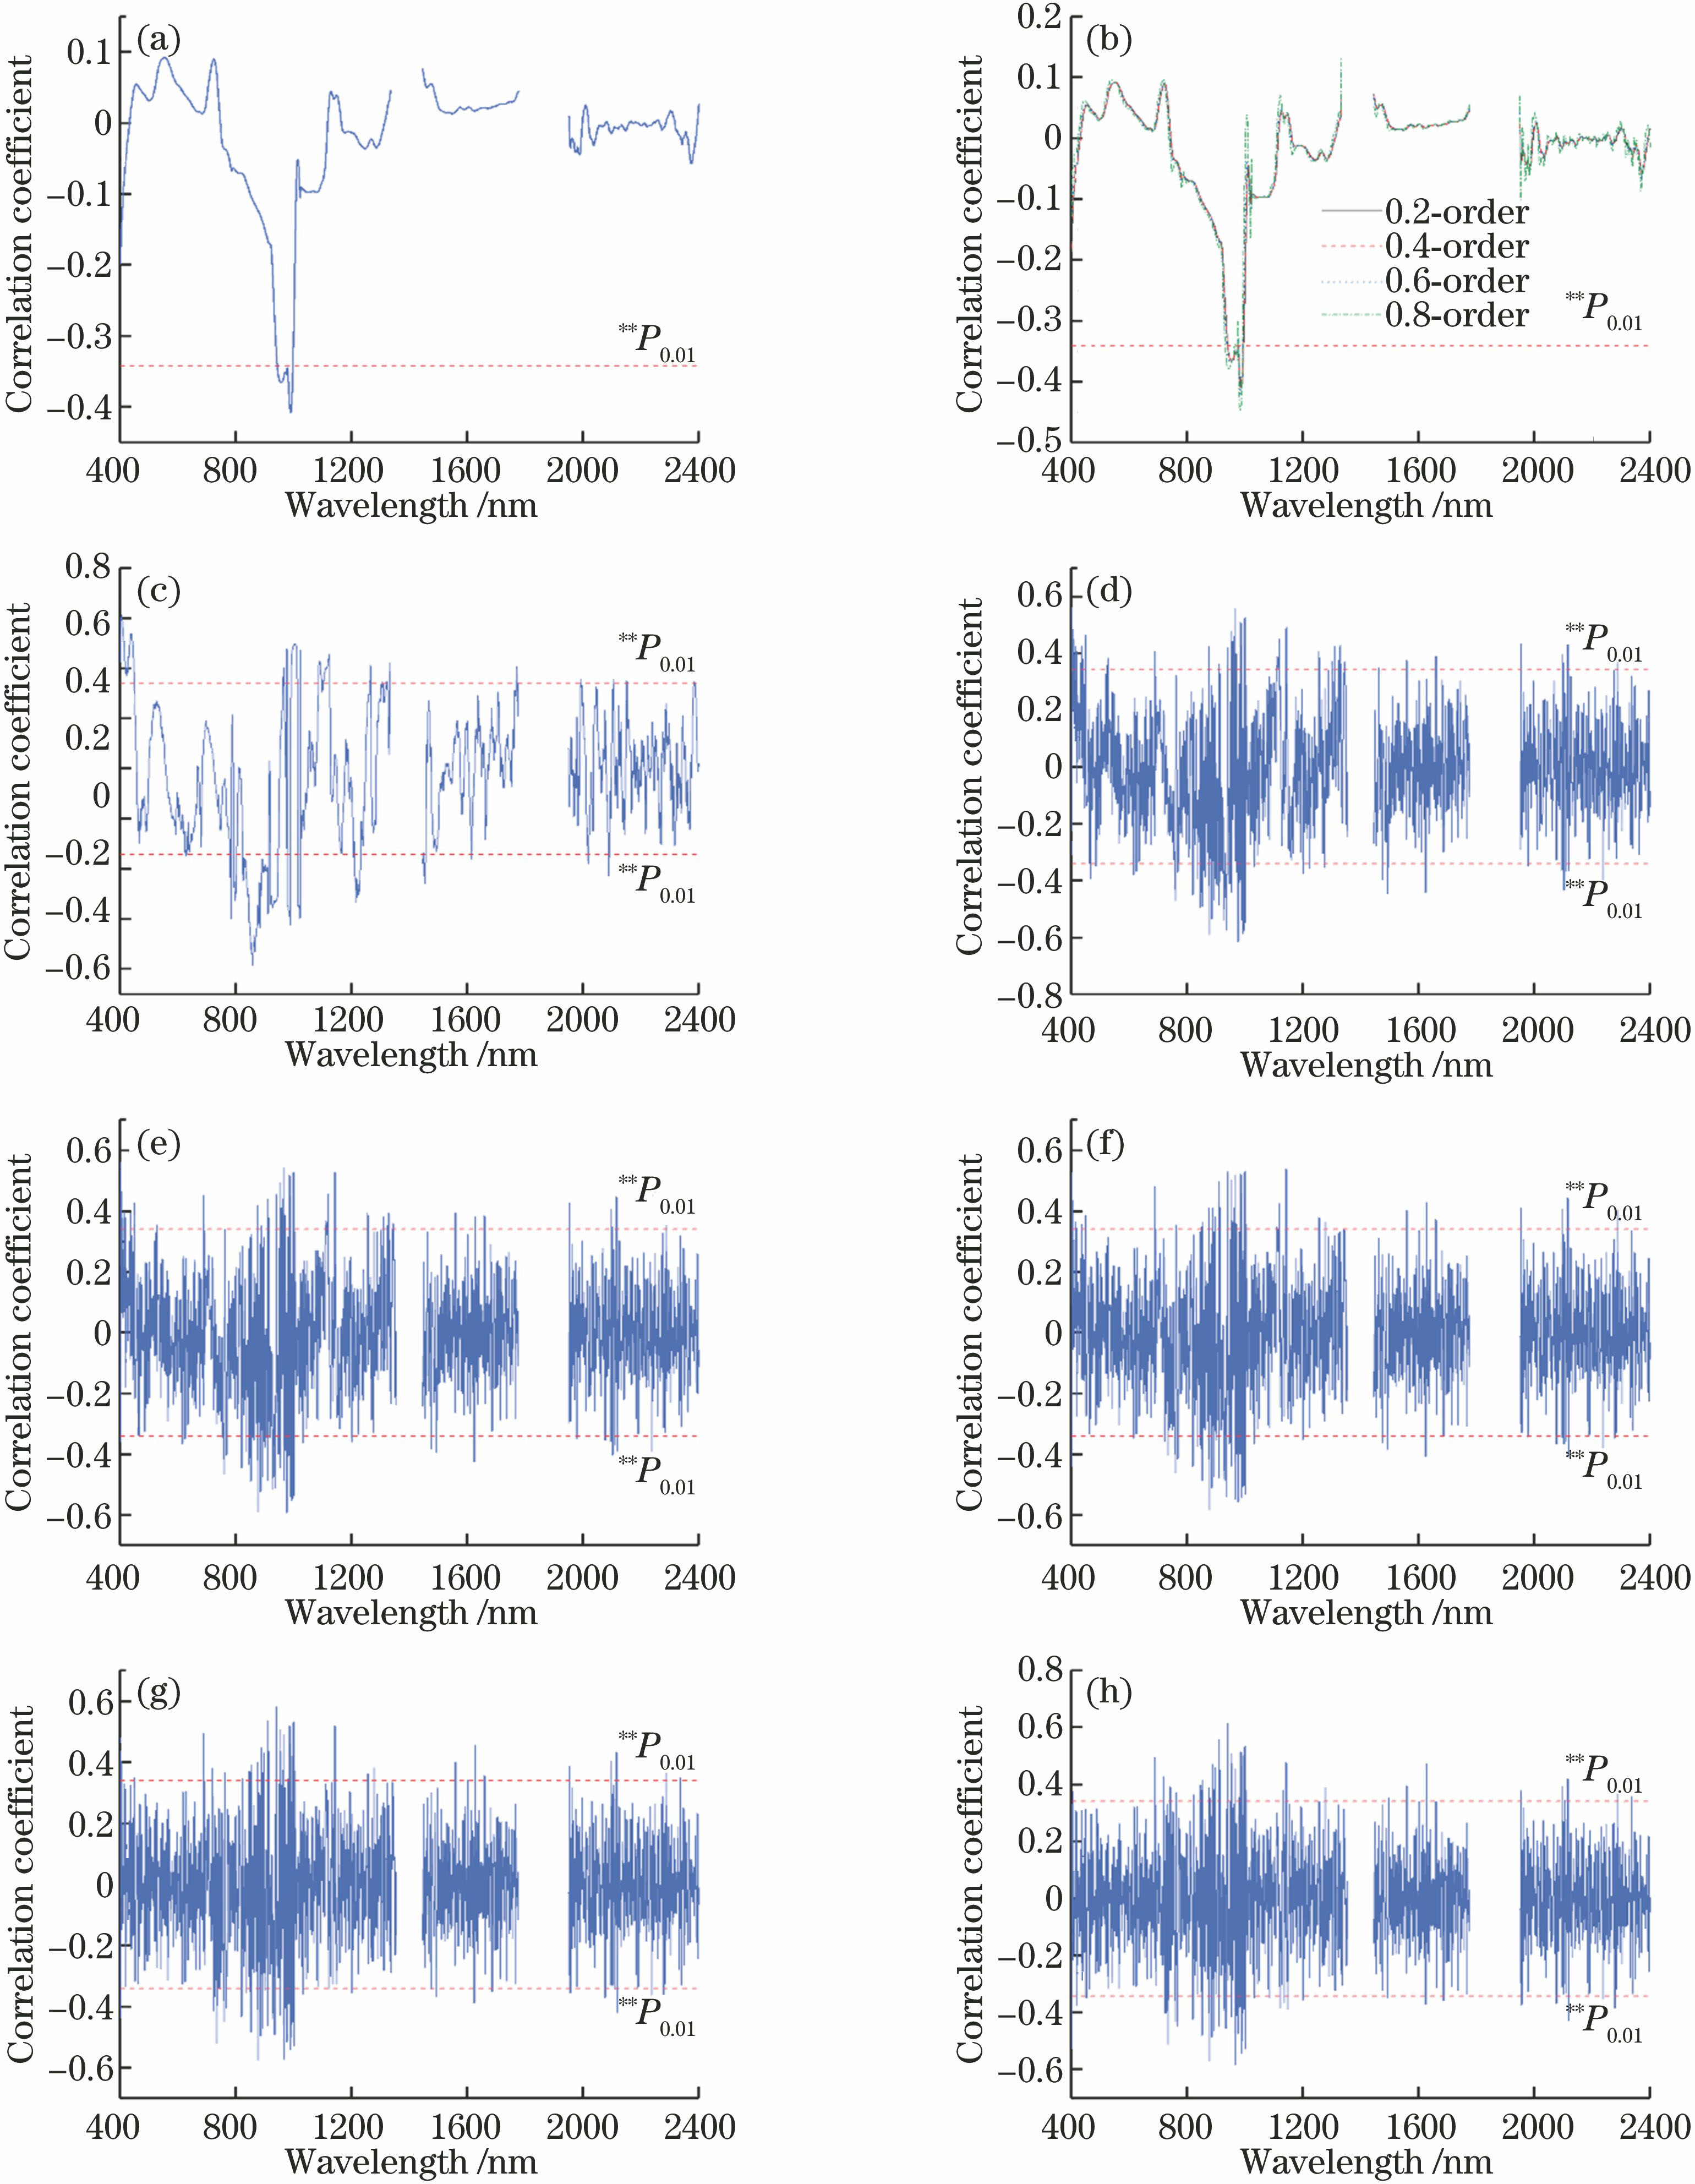
    Fig. 2. Correlation coef?cients between MLWC and spectral re?ectance. (a) Correlation coefficients between MLWC and 0-order spectrum; (b) correlation coefficients between MLWC and 0.2, 0.4, 0.6, 0.8-order spectra; (c) correlation coefficients between MLWC and 1-order spectrum; (d) correlation coefficients between MLWC and 1.2-order spectrum; (e) correlation coefficients between MLWC and 1.4-order spectrum; (f) correlation coefficients between MLWC and 1.6-order spectrum; (g) correlation coefficients bet
    Fitting analysis results between measured values and predicted values by BP neural network model. (a) 1-order differential; (b) 1.2-order differential; (c) 1.4-order differential; (d) 1.6-order differential; (e) 1.8-order differential; (f) 2-order differentials
    Fig. 3. Fitting analysis results between measured values and predicted values by BP neural network model. (a) 1-order differential; (b) 1.2-order differential; (c) 1.4-order differential; (d) 1.6-order differential; (e) 1.8-order differential; (f) 2-order differentials
    DifferentialorderNumberof bandsBand combinationsselected by SPA/nm
    00
    0.20
    0.40
    0.60
    0.80
    12867、2089
    1.213420,486,616,690,912,957,1223,1660,1978,2103,2111,2238,2276
    1.44859,888,1255,1953
    1.65420,1278,1627,2238,2286
    1.86823,875,892,1004,1627,2286
    25888,911,1144,1686,2286
    Table 1. Numbers and combinations of bands selected by SPA
    DifferentialorderOptimal BPneuralnetworkstructureθCRC2θVRV2δ
    12-4-10.6920.7370.4960.6281.395
    1.213-12-11.0080.4720.3660.7892.050
    1.44-5-11.1740.4820.4170.8091.943
    1.65-9-10.5530.8280.6340.8071.495
    1.86-4-10.7010.7510.2270.9173.253
    25-8-10.7330.6980.3080.8402.298
    Table 2. Comparison of modeling results
    Hasan Umut, Sawut Mamat, Chunyue Ma. Hyperspectral Estimation of Wheat Leaf Water Content Using Fractional Differentials and Successive Projection Algorithm-Back Propagation Neural Network[J]. Laser & Optoelectronics Progress, 2019, 56(15): 153002
    Download Citation