
Feiyu Jiao, Shangsheng Wen, Bingxu Ma, Bo Zhang, Xinyu Jiang, Yunle Lu, Weizhao Huang, Qibao Wu. Design of Stereo LED Plant Light Source System with High Spatial Illumination Uniformity[J]. Acta Optica Sinica, 2020, 40(18): 1822002
- Acta Optica Sinica
- Vol. 40, Issue 18, 1822002 (2020)
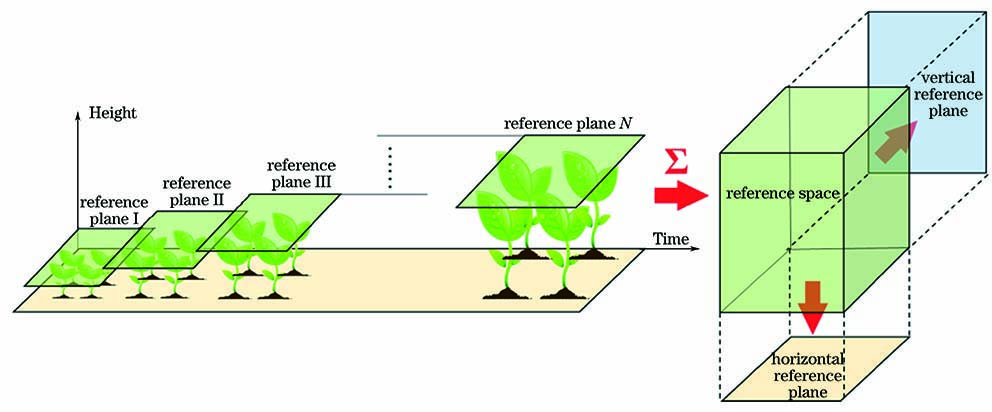
Fig. 1. Spatial illumination uniformity evaluation system
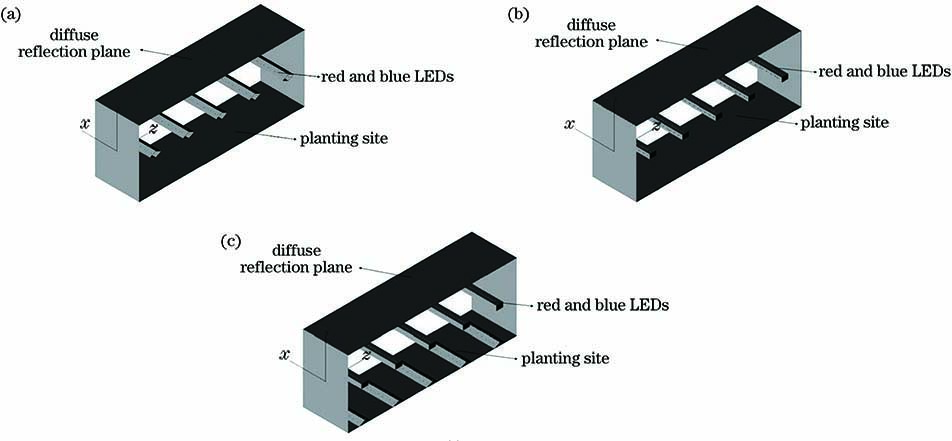
Fig. 2. Scheme structures of plant growth shelves. (a) Scheme I; (b) scheme II; (c) scheme III
Fig. 3. Local section of plant growth shelf in scheme I and related parameters
Fig. 4. Local section of plant growth shelf in scheme II and related parameters
Fig. 5. Local section of plant growth shelf in scheme III and related parameters
Fig. 6. SN corresponding to each level of each factor in scheme I. (a) Illumination uniformity of horizontal plane; (b) illumination uniformity of vertical plane; (c) color-mixed uniformity of horizontal plane; (d) color-mixed uniformity of vertical plane
Fig. 7. SN corresponding to each level of each factor in scheme II. (a) Illumination uniformity of horizontal plane; (b) illumination uniformity of vertical plane; (c) color-mixed uniformity of horizontal plane; (d) color-mixed uniformity of vertical plane
Fig. 8. SN corresponding to each level of each factor in scheme III. (a) Illumination uniformity of horizontal plane; (b) illumination uniformity of vertical plane; (c) color-mixed uniformity of horizontal plane; (d) color-mixed uniformity of vertical plane
Fig. 9. Variation of each attribute with factor A. (a) Illumination uniformity and color-mixed uniformity of horizontal plane;(b) illumination uniformity and color-mixed uniformity of vertical plane
Fig. 10. Variation of each attribute with factor C. (a) Illumination uniformity and color-mixed uniformity ofhorizontal plane; (b) illumination uniformity and color-mixed uniformity of vertical plane
Fig. 11. Optimal result of plant growth shelf. (a) Illumination map of horizontal plane; (b) chromaticity map of horizontal plane; (c) full color-mixed map of horizontal plane; (d) illumination map of vertical plane; (e) chromaticity map of vertical plane; (f) full color-mixed map of vertical plane
Fig. 12. Plant growth model
Fig. 13. Illumination uniformity and color-mixed uniformity at each plant height. (a) Illumination uniformity and color-mixed uniformity of planting plane; (b) illumination uniformity and color-mixed uniformity of plant top plane; (c) illumination uniformity and color-mixed uniformity of plant side plane
Fig. 14. Array LED structure and uniformity properties. (a) Array LED structure; (b) illuminance uniformity of reference surface at each plant height; (c) illuminance distribution of vertical reference plane
| |||||||||||||||||||||||||||||||||
Table 1. Influence factors of plant growth shelf in scheme I and its control levels
| |||||||||||||||||||||||||||||||||
Table 2. Influence factors of plant growth shelf in scheme II and its control levels
| |||||||||||||||||||||||||||||||||||||||
Table 3. Influence factors of plant growth shelf in scheme III and its control levels
| ||||||||||||||||||||||||||||||||||||||||||||||||||||||||||||||||||||||||||||||||||||||||||||||
Table 4. L9(34) orthogonal experimental design in scheme I
| ||||||||||||||||||||||||||||||||||||||||||||||||||||||||||||||||||||||||||||||||||||||||||||||
Table 5. L9(34) orthogonal experimental design in scheme II
| |||||||||||||||||||||||||||||||||||||||||||||||||||||||||||||||||||||||||||||||||||||||||||||||||||||||||||||||||||||||||||||||||||||||||||||||||||||||||||||||||||||||||||||||||||||||||||||||||||
Table 6. L18(37) orthogonal experimental design in scheme III
|
Table 7. Contribution of each factor to illumination uniformity and mixed-color uniformity

Set citation alerts for the article
Please enter your email address
© Copyright 2018-2021 | Chinese Laser Press. All Rights Reserved 沪ICP备15018463号-20