Author Affiliations
1School of Automation and Electronic Information, Xiangtan University, Xiangtan, Hunan 411100 China2National CIMS Engineering Technology Research Center, Tsinghua University, Beijing 100084, Chinashow less
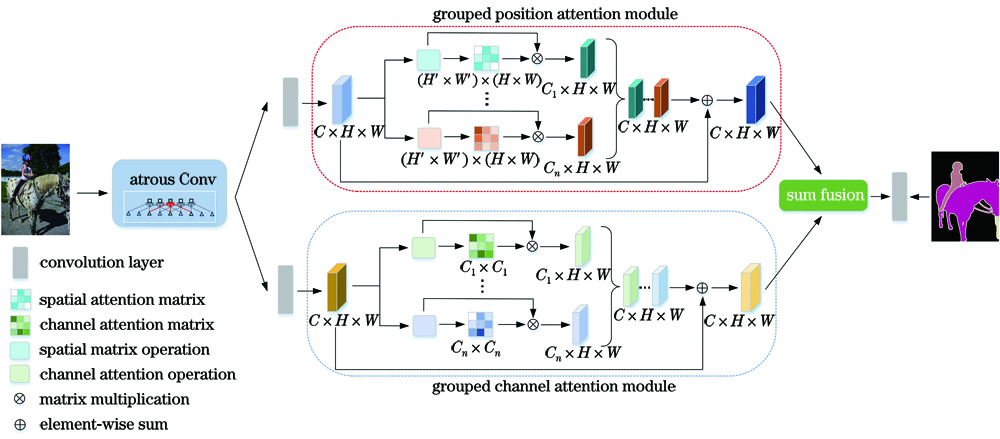
Fig. 1. Structure of the grouped double attention network
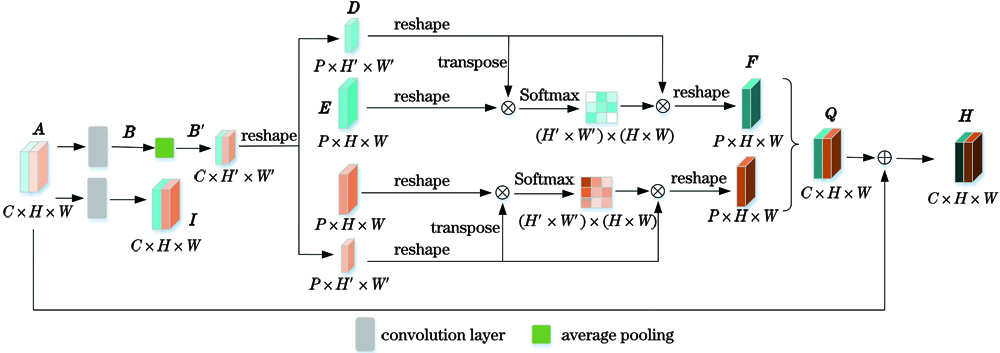
Fig. 2. Structure of the GPAM
Fig. 3. Structure of the GCAM
Fig. 4. Attention maps of CAM and GCAM. (a) CAM; (b) GCMA
Fig. 5. Segmentation results of different methods. (a) Original image; (b) real semantic label; (c) basic method; (d) our method
| Method | Backbone | PAM | GNP | mIoU /% |
|---|
| Baseline1 | ResNet50 | | | 69.8 | | Baseline2 | ResNet50 | √ | | 83.2 | | Our1 | ResNet50 | | 1 | 84.1 | | Our2 | ResNet50 | | 2 | 84.9 | | Our3 | ResNet50 | | 4 | 84.4 | | Our4 | ResNet50 | | 8 | 84.2 | | Our5 | ResNet50 | | 16 | 82.9 | | Our6 | ResNet50 | | 64 | 81.1 |
|
Table 1. Influence of the number of GPAM groups on network performance
| Method | Backbone | PAM | NBP | mIoU /% |
|---|
| Baseline2 | ResNet50 | √ | | 83.2 | | Our7 | ResNet50 | | 32 | 85.0 | | Our8 | ResNet50 | | 16 | 85.0 | | Our2 | ResNet50 | | 8 | 84.9 |
|
Table 2. Influence of the number of GPAM basis sets on network performance
| Method | Backbone | CAM | GNC | mIoU /% |
|---|
| Baseline3 | ResNet50 | √ | | 82.6 | | Our-1 | ResNet50 | | 8 | 83.9 | | Our-2 | ResNet50 | | 16 | 84.1 | | Our-3 | ResNet50 | | 32 | 84.9 |
|
Table 3. Influence of the number of GCAM groups on network performance
| Method | GNC | Memory /G | mIoU /% |
|---|
| CAM | -- | 1.00 | 82.6 | | GCAM | 8 | 0.85 | 83.9 | | GCAM | 16 | 0.73 | 84.1 | | GCAM | 32 | 0.68 | 84.9 |
|
Table 4. Memory occupied by CAM and GCAM
| Method | Backbone | CAM | PSC | mIoU /% |
|---|
| Baseline3 | ResNet50 | √ | | 82.6 | | Our-4 | ResNet50 | | 4 | 84.7 | | Our-3 | ResNet50 | | 8 | 84.9 | | Our-5 | ResNet50 | | 16 | 84.3 |
|
Table 5. Influence of the size of the GCAM pooling on segmentation performance
| Method | PAM | CAM | GPAM | GCAM | mIoU /% |
|---|
| Baseline1 | | | | | 69.8 | | Baseline2 | √ | | | | 83.2 | | Baseline3 | | √ | | | 82.6 | | Our7 | | | √ | | 85.0 | | Our-3 | | | | √ | 84.9 | | GDANet | | | √ | √ | 85.6 |
|
Table 6. Experimental results of grouped double attention network and Baseline
| Method | FCN | DeepLabv2 | DPN[25] | DeepLabv3 | PSP | DANet | Ours |
|---|
| Aero | 82.4 | 84.4 | 87.7 | 88.0 | 87.4 | 90.1 | 92.8 | | Bike | 47.4 | 54.5 | 59.4 | 56.3 | 56.3 | 61.8 | 67.8 | | Bird | 81.2 | 81.5 | 78.4 | 86.3 | 85.7 | 91.7 | 91.8 | | Boat | 68.6 | 63.6 | 64.9 | 69.4 | 79.4 | 75.6 | 82.5 | | Bottle | 75.3 | 65.9 | 70.3 | 72.2 | 73.8 | 75.6 | 76.7 | | Bus | 81.3 | 85.1 | 89.3 | 90.3 | 92.3 | 93.1 | 95.0 | | Car | 79.9 | 79.1 | 83.5 | 85.7 | 87.3 | 88.5 | 90.7 | | Cat | 81.6 | 83.4 | 86.1 | 89.6 | 92.3 | 92.9 | 92.7 | | Chair | 33.7 | 30.7 | 31.7 | 28.9 | 53.3 | 53.4 | 61.7 | | Cow | 68.4 | 74.1 | 79.9 | 85.9 | 90.4 | 93.3 | 94.8 | | Table | 52.3 | 59.8 | 62.6 | 59.3 | 75.2 | 74.3 | 81.3 | | Dog | 76.4 | 79 | 81.9 | 84.2 | 87.3 | 92 | 93.5 | | Horse | 64.9 | 76.1 | 80 | 80.2 | 85.9 | 89.1 | 92.4 | | Mbike | 73.4 | 83.2 | 83.5 | 84.2 | 83.8 | 85.4 | 88.7 | | Person | 81.2 | 80.8 | 82.3 | 82.8 | 84.5 | 85.7 | 88.3 | | Plant | 56.7 | 59.7 | 60.5 | 56.0 | 68.1 | 62.8 | 70.0 | | Sheep | 69.7 | 82.2 | 83.2 | 78.5 | 87 | 91.6 | 92.6 | | Sofa | 50.9 | 50.4 | 53.4 | 51.6 | 73 | 74.6 | 78.1 | | Train | 78.5 | 73.1 | 77.9 | 84.5 | 91.1 | 90.2 | 92.0 | | Tv | 70.1 | 63.7 | 65.0 | 69.6 | 71.5 | 73.1 | 77.1 | | mIoU | 69.8 | 71.6 | 74.1 | 75.1 | 80.9 | 82.4 | 85.6 |
|
Table 7. Experimental results of different methods in the PASCAL VOC2012 validation set unit: %
| Method | FCN | PSP | DANet | Ours | Method | FCN | PSP | DANet | Ours |
|---|
| Road | 95.1 | 96.4 | 97.2 | 97.5 | Sky | 91.4 | 92 | 92.4 | 92.8 | | Sidewalk | 67.8 | 74.4 | 77.8 | 79.3 | Person | 68.8 | 70.4 | 71.9 | 72.9 | | Building | 88.5 | 89.1 | 89.8 | 90.1 | Rider | 47.9 | 49.9 | 52.2 | 53.3 | | Wall | 50.5 | 52.9 | 56.1 | 57.1 | Car | 90.3 | 91.4 | 92.4 | 92.4 | | Fence | 44.6 | 47.9 | 48.6 | 51.2 | Truck | 73.8 | 73.9 | 82.8 | 79.2 | | Pole | 35.6 | 39.9 | 40.8 | 43.4 | Bus | 73.6 | 75.8 | 79.4 | 81.9 | | Traffic light | 47.0 | 51.9 | 53.0 | 53.5 | Train | 62.8 | 66.4 | 70.8 | 74.5 | | Traffic sign | 60.4 | 62.4 | 65.2 | 66.4 | Motocycle | 51.7 | 55.0 | 58.9 | 58.7 | | Vegetation | 88.6 | 89.4 | 89.7 | 89.9 | Bicycle | 63.1 | 63.6 | 65.8 | 66.7 | | Terrain | 55.6 | 57.6 | 60.7 | 60.9 | | | | | | | mIoU | 66.2 | 68.4 | 70.8 | 71.7 | mIoU | 66.2 | 68.4 | 70.8 | 71.7 |
|
Table 8. Experimental results of different methods on the Cityscapes validation set unit: %