• Chinese Optics Letters
  • Vol. 15, Issue 9, 090008 (2017)
Kokila Egodage1、2, Christian Matthäus1、2, Sebastian Dochow1、2, Iwan W. Schie1、2, Carmen Härdtner3, Ingo Hilgendorf3, and Jürgen Popp1、2、*
Author Affiliations
  • 1Leibniz Institute of Photonic Technology, Albert Einstein Straße 9, Jena 07745, Germany
  • 2Institute of Physical Chemistry and Abbe Center of Photonics, Friedrich-Schiller-University, Jena 07743, Germany
  • 3University Heart Center Freiburg, Department of Cardiology and Angiology I, Faculty of Medicine, University of Freiburg, Germany
  • show less
    DOI: 10.3788/COL201715.090008 Cite this Article Set citation alerts
    Kokila Egodage, Christian Matthäus, Sebastian Dochow, Iwan W. Schie, Carmen Härdtner, Ingo Hilgendorf, Jürgen Popp. Combination of OCT and Raman spectroscopy for improved characterization of atherosclerotic plaque depositions[J]. Chinese Optics Letters, 2017, 15(9): 090008 Copy Citation Text show less
    (Color online) Examples of OCT images of an aorta area with calcified depositions and a comparison with histology of the same region. (A) An OCT C-scan image of a 4 mm×4 mm area with large inclusions. (B) Representative B scans of the positions indicated in (A). P1 and P2 show obvious calcification, which was confirmed by histopathology shown in row (C). P3 does not show significant inclusions. The scale bar in (B) is 1 mm.
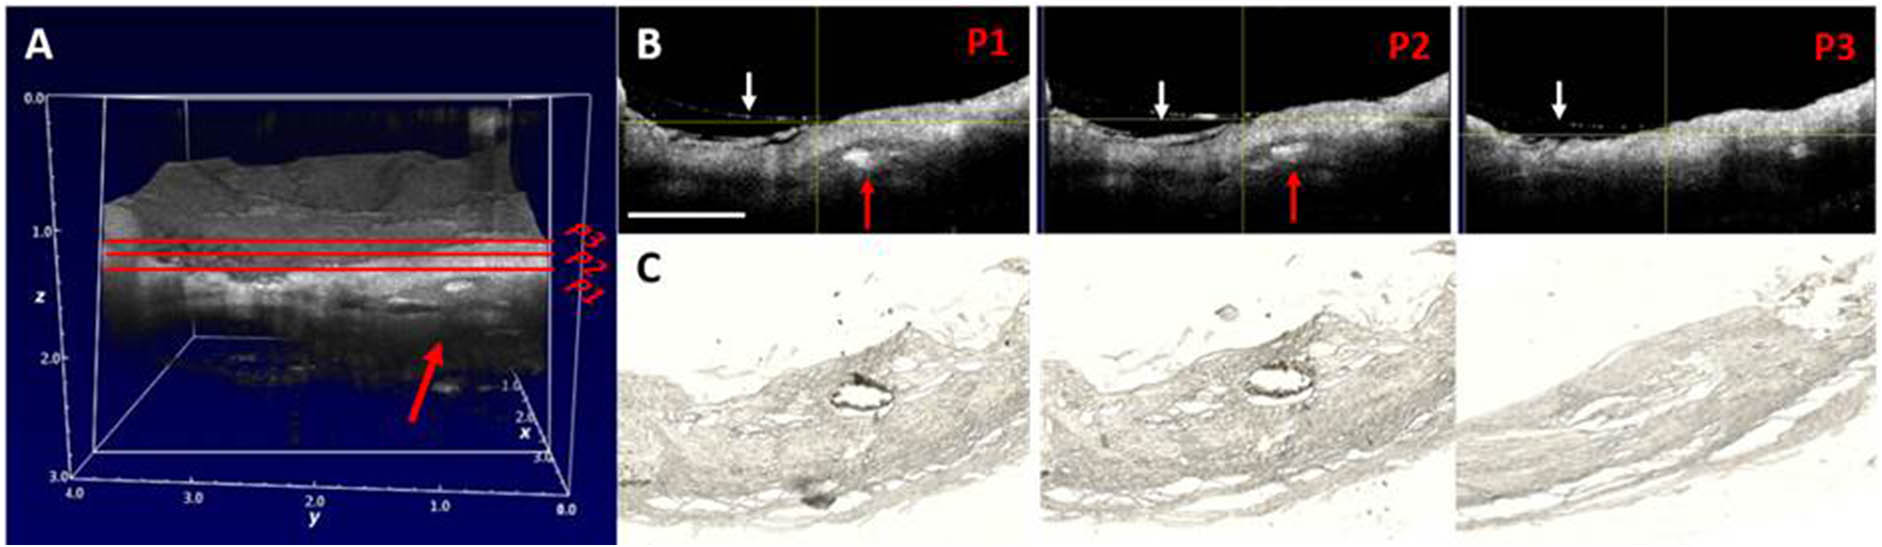
    Fig. 1. (Color online) Examples of OCT images of an aorta area with calcified depositions and a comparison with histology of the same region. (A) An OCT C-scan image of a 4mm×4mm area with large inclusions. (B) Representative B scans of the positions indicated in (A). P1 and P2 show obvious calcification, which was confirmed by histopathology shown in row (C). P3 does not show significant inclusions. The scale bar in (B) is 1 mm.
    (Color online) OCT and Raman images of the calcified plaque deposition also shown in Figure 1. (A) and (B) OCT C and B scans of the aorta wall, whereby (B) shows the top view. The corresponding Raman images and the associated Raman spectra are shown in (C) and (D), as well as (E) and (F) for a value chain analysis (VCA) and K-means cluster analysis, respectively.
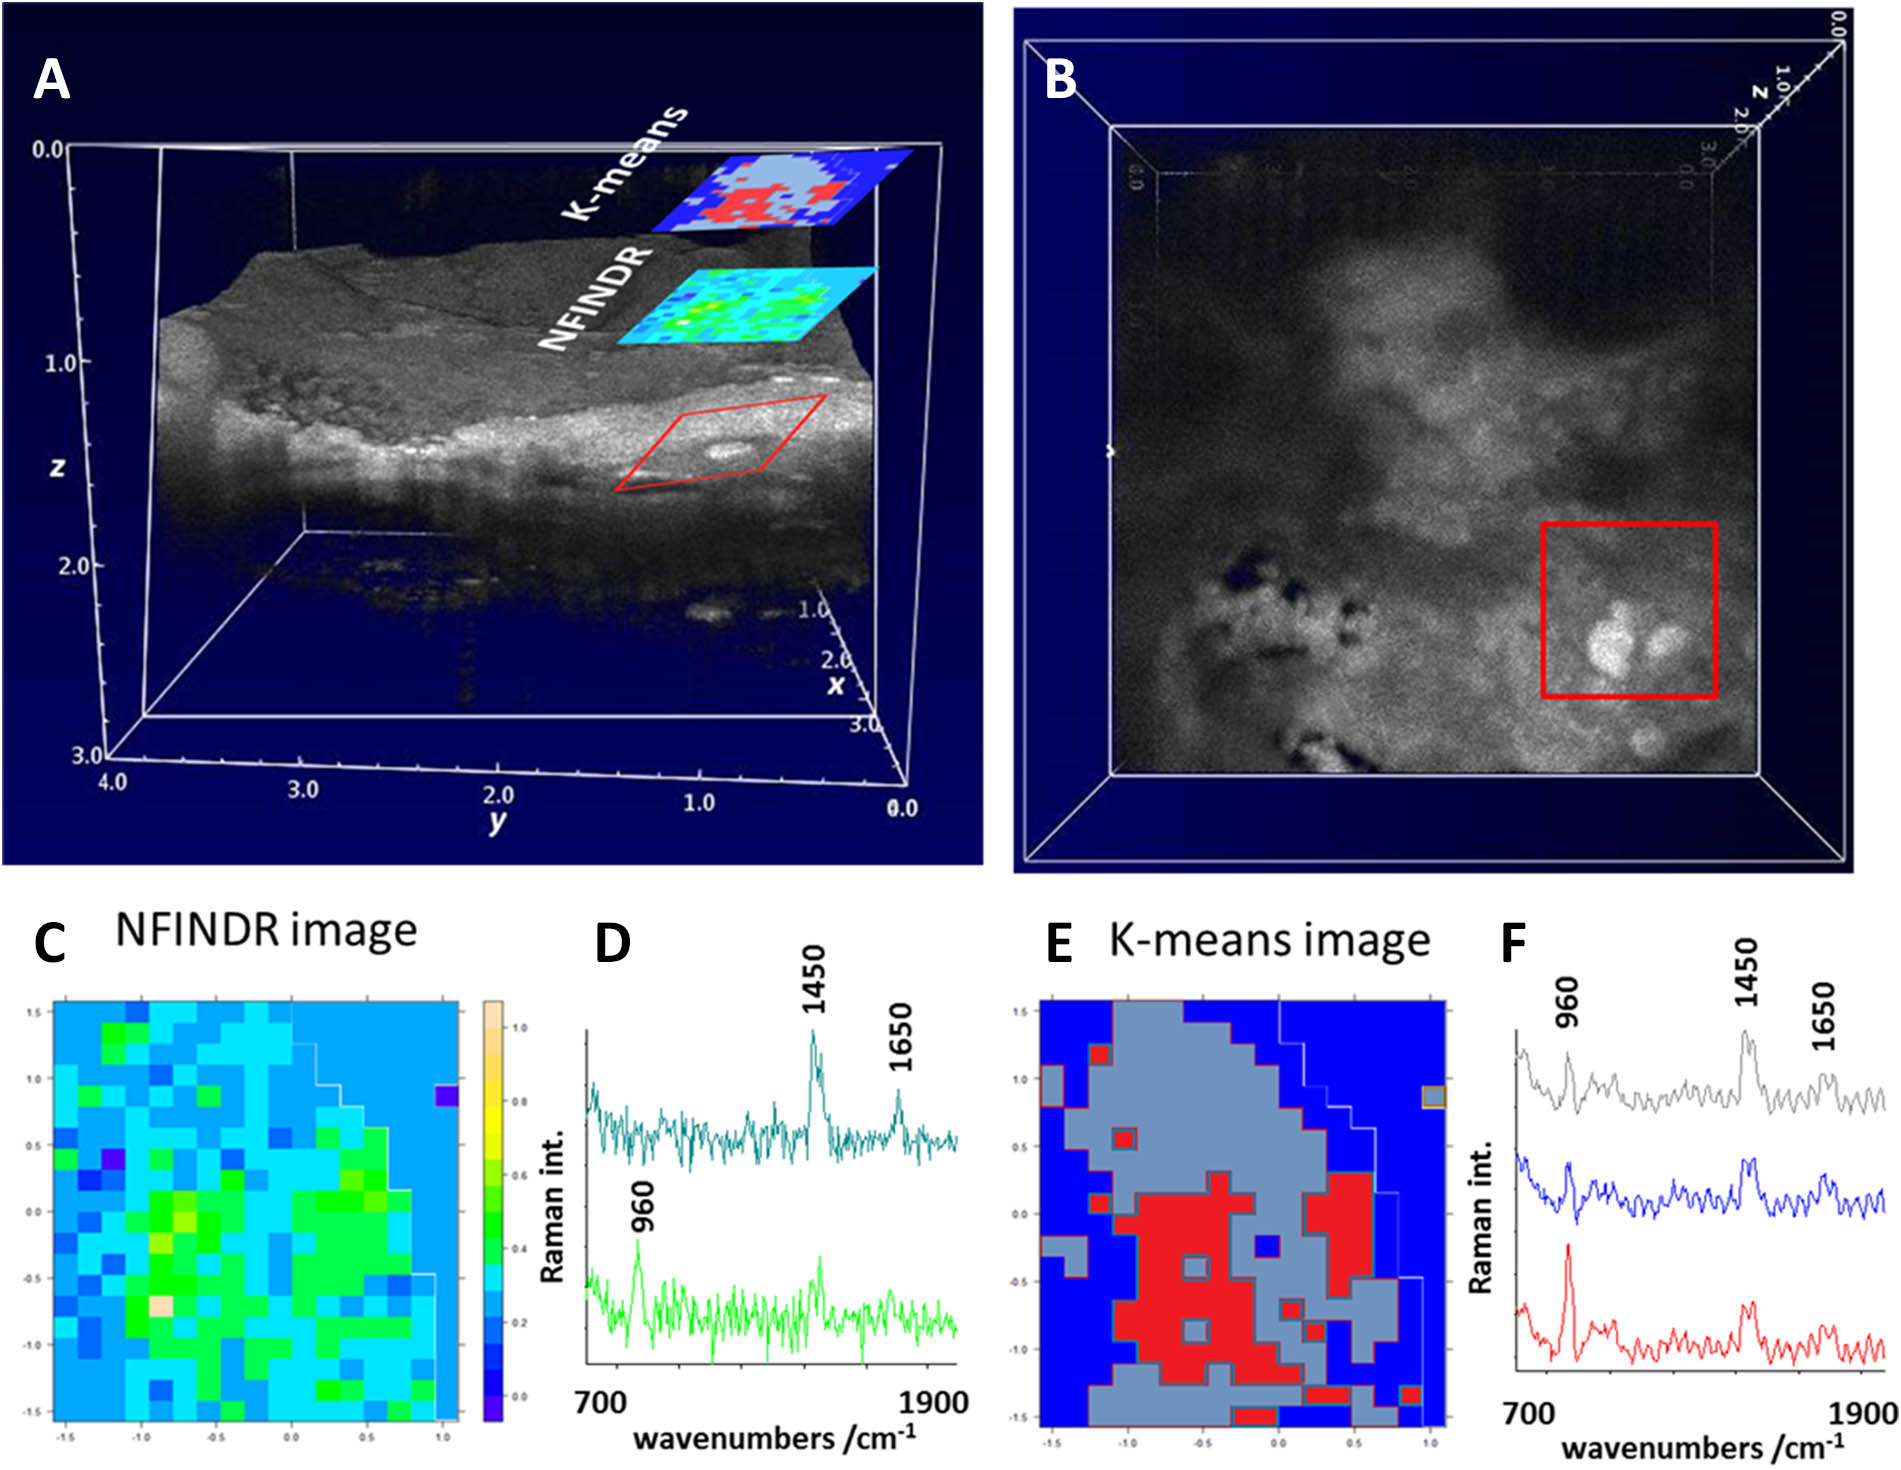
    Fig. 2. (Color online) OCT and Raman images of the calcified plaque deposition also shown in Figure 1. (A) and (B) OCT C and B scans of the aorta wall, whereby (B) shows the top view. The corresponding Raman images and the associated Raman spectra are shown in (C) and (D), as well as (E) and (F) for a value chain analysis (VCA) and K-means cluster analysis, respectively.
    Kokila Egodage, Christian Matthäus, Sebastian Dochow, Iwan W. Schie, Carmen Härdtner, Ingo Hilgendorf, Jürgen Popp. Combination of OCT and Raman spectroscopy for improved characterization of atherosclerotic plaque depositions[J]. Chinese Optics Letters, 2017, 15(9): 090008
    Download Citation