Abstract
The biochemical composition of atherosclerotic plaques is closely related to plaque stability and, therefore, to the associated risk of plaque evolution and rupture. Combinations of current imaging modalities, such as optical coherence tomography (OCT) with spectroscopic methods, therefore offer the possibility of concurrently obtaining morphological as well as chemical information. Raman spectroscopy is one of the most promising techniques that can be combined with intravascular imaging modalities. A microscopy setup merging both techniques has been applied to characterize plaque depositions of a human aorta affected by the disease. Calcified depositions were clearly identified and subsequently confirmed by histopathology.Cardiovascular diseases are one of the most common causes of mortality worldwide, usually resulting as a consequence of excess energy storage and aging[1]. Due to oxidative stress and other internal factors, arterial membranes become susceptible to deposition and permeation of various lipids circulating through the bloodstream and crystalline calcium (usually in the form of calcium apatite). This process is followed by an accumulation of monocytes, a type of white blood cells that differentiate into macrophages, which are responsible for lipid decomposition within tissues. If these cells are overwhelmed with metabolistic stress, the subsequent cell death and cellular debris also contribute to the arterial swelling. Prolonged accumulations increase the swelling and can lead to atherothrombosis with fatal consequences to the patient, such as a myocardial infarction or stroke. The biochemical composition of inner arterial plaques can vary and is influenced by various risk factors, for instance, hypertonia, hyperlipidemia, insulin resistance, smoking, or obesity[2]. Moreover, it is well known that the severity of a plaque and its stability are strongly correlated with its biochemical composition[3]. Despite the high importance, the identification of vulnerable plaques remains one of the most important and challenging aspects in cardiology. There are several types of vulnerable plaques with distinct biochemical compositions that, for example, are characterized by complex lipid cores, thin fibrous caps infiltrated by macrophages, proteoglycan matrices in a smooth muscle cell-rich environment, intra-plaque hemorrhage, or calcific nodules protruding into the vessel lumen[4]. Thus, specific biochemical information about the composition of a plaque would greatly improve the risk assessment and management. Such knowledge could also facilitate a better identification of high-risk individuals. Apart from several types of high-risk vulnerable plaques, there are various types, which are not prone to rupture, but have lipid or other debris that can be depleted by medication. Better insight about the biochemical composition of plaque formations can, therefore, offer new therapeutic and medication strategies, and greatly improve the outcome for the patient.
Intravascular ultrasound (IVUS) and optical coherence tomography (OCT) are currently the most prominent catheter-based imaging techniques for the localization of atherosclerotic plaque depositions with complementing advantages in terms of penetration depth, resolution, and application of contrasting agents. Especially, the ten times higher resolution of OCT allows for very detailed characterization of morphological features, such as different plaque formations, thin fibrous caps, and accurate measurements of lesion lengths. In any case, both modalities provide primarily morphological information rather than information about the biochemical composition of the plaque, and require an extensive empirical expertise for the interpretation. Hence, there is a dire need for additional biochemical information that is complementary to the imaging information. Spectroscopic methods, such as near infrared spectroscopy (NIRS) and Raman spectroscopy, could fill this gap. NIRS has been shown to be specifically sensitive to the identification of lipid pools in plaques[5,6]. NIRS probes for vibrational overtones and combinations of molecular vibrations provide molecular contrast in lipids, such as cholesterol or triglycerides, against the collagen of the vessel wall. NIRS is limited in giving non-specific depth information[7], but offers molecular information of especially bulk material without interference from water. In combination with sophisticated data analysis, pullback chemometric images of inner arterial walls can be generated. To support the plaque visualization, NIRS is commercialized in combination with IVUS and has very recently been successfully applied in clinical studies[8,9]. Along with the development of NIRS for the characterization of plaque compositions, the potential of Raman spectroscopy has also been investigated. As a vibrational spectroscopic technique, it is closely related to that of NIRS. The first Raman studies of atherosclerotic tissue were approximately reported at the same time as the near infrared (NIR) data[10]. Meanwhile, there had been a few attempts in applying Raman spectroscopy for the characterization of atherosclerotic plaques[11,12]. Arterial plaque depositions are mainly composed of triglycerides, cholesterol, cholesterol-ester, crystalline calcium, and proteoglycans. Spectroscopically, these components can be easily identified as well as quantified[13,14]. Quantified information would improve the direct differentiation between lipids and crystalline calcium, as lipids are important participants in some apatitic biomineralization processes[15]. Due to the inherently weak Raman effect, it is currently not feasible to develop imaging modalities that can be applied during intravascular interventions. Alternatively, Raman spectroscopy can be combined with other imaging modalities[16–18]. For intravascular applications, a combination with OCT is attractive, since important technical aspects for their implementation are complementary. Both modalities use NIR laser light as an excitation source, both have similar tissue penetration depth, and the signal can be collected by optical fibers. In the following, we present the first results, to the best of our knowledge, of investigating intra-arterial plaque depositions by a combined OCT/Raman microscope. The results offer technical insight into the feasibility of the approach for future catheter-based probe designs.
Instrumentation: A combined OCT/Raman system was developed by combining a spectral domain (SD) OCT device (Telesto II 1325 LR, Thorlabs, Germany) with a spectrometer (Shamrock 303i, Andor, Northern Ireland) in the Czerny–Turner configuration via a probe cage configuration[19]. The OCT-scanning path and the Raman signal excitation and collection path are combined by a set of dichroic mirrors. The OCT probe head consists of a galvanic scanning unit and a 35 mm achromatic double with antireflective (AR) coating, which is used as the objective lens (Edmund Optics, US), surrounded by an LED illumination ring for the visualization of the sample. The galvanic scanning unit consists of two scanning mirrors for beam positioning in the sample plane. The ‘slow’ scanning mirror was modified so that it transmits visible light received from the sample plane onto a CCD chip housed in the probe cage and allows the acquisition of brightfield images. The scanning mirrors also scan the field of view (FOV) to acquire the OCT images. The OCT source and spectrometer are coupled to the probe head by fiber-optic connector/angled physical contact (FC/APC) fibers. Collimated light from the 1325 nm broadband superluminescent diode (SLD) is directed to a beam splitter cube, where the beam is split by a 50/50 beam splitter into the sample and reference arm of the OCT. The sample beam is then directed to the galvanic scanning unit and focused by the objective lens onto the sample. The back reflected light is collected by the objective lens, combined by the 50/50 beam splitter with the light from the reference arm, and recoupled into the FC/APC fiber of the OCT spectrometer. The optimum OCT reference intensity was regulated with a variable aperture placed in the reference arm.
Sign up for Chinese Optics Letters TOC. Get the latest issue of Chinese Optics Letters delivered right to you!Sign up now
The OCT system is equipped with a 1325 nm broadband SLD with a bandwidth of 200 nm. The excitation wavelength allows for deep tissue penetration due to reduced scattering effects[20]. The ThorImage OCT software, capable of capturing A (single point), B (line), and C [three-dimensional (3D) volumetric] scans was used to view B scans and adjust the image contrast during the measurement.
The Raman spectrometer consisted of a grating at a 3.4° nominal blaze angle and a back-illuminated deep depletion detector (DU420A BEX2-DD, Andor, Northern Ireland). The 785 nm single-mode Raman excitation laser (Matchbox, Integrated Optics, Lithuania) was coupled to the probe cage with a 105 µm multimode fiber, which generates a spot size of μm. The collection fiber is 300 µm in diameter with 21 integrated collection cores.
A customized LabVIEW software was developed to acquire brightfield images, scanning OCT images, and Raman spectra either in the form of a map or single points. For precise sample positioning, an OCT B scan was performed before acquiring a complete C scan over the FOV followed by the Raman measurement. For an FOV of , 1000 OCT scans were recorded, resulting in a resolution of 6 µm. Raman spectra and images were collected point-wise within a size adjusted area of interest with a signal integration time of 1 s per spectrum. The laser power was kept at 10 mW at the focal plane.
Samples: Human carotid artery plaques were donated by patients who underwent an endarterectomy at the Heart Center Freiburg-Bad Krozingen, University of Freiburg, Freiburg, Germany after written consent. Samples were fixed in 5% para-formaldehyde and stored at 4°C until inspection by the described instrument setup. In order to access the inspection positions, the artery was cut along the direction of the blood flow. For histopathology inspection, the samples where embedded in Tissuetec® and cryo-sectioned using a CM1860 cryotome (Leica, Germany) at into sections of 10 µm.
Data analysis: OCT images were analyzed using the ThorImage OCT or LabVIEW software. Raman spectra were background corrected via a sensitive nonlinear iterative peak (SNIP) algorithm[21] and area normalized. The image contrast of 3D surface volume images was adjusted post acquisition using the ThorImage OCT software. Raman images were generated by either the N-FINDR spectral unmixing algorithm[22,23] or by a K-means clustering, in both cases using R software packages[24].
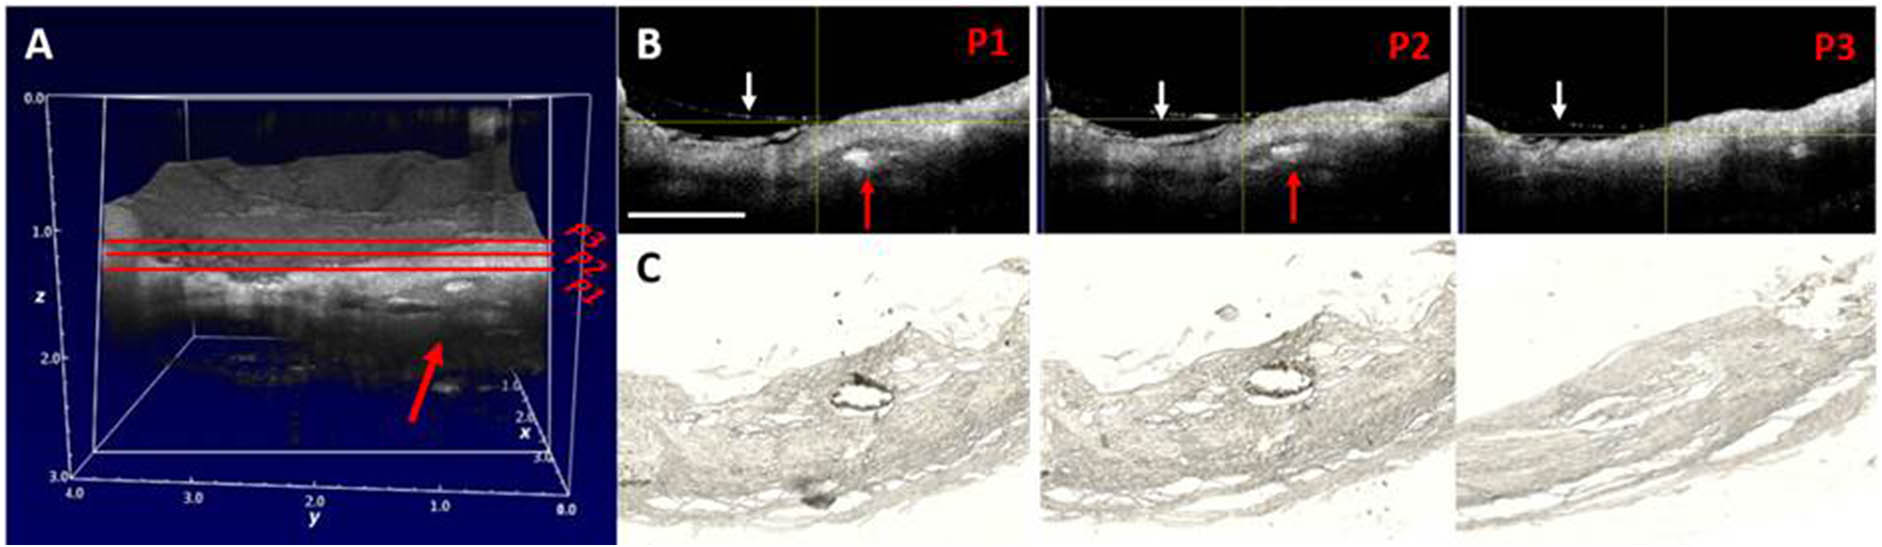
In order to identify abnormalities in the tissue, several aorta positions were visualized by OCT scans prior to Raman imaging. OCT C scans were acquired from a volume of . In areas that showed inclusions, i.e. a higher refractive index, Raman images were recorded with resolutions varying from 50 to 100 µm with area sizes of 0.25 to . Because of the higher refractive indices of lipids and crystalline calcium, these areas are likely to contain plaque depositions. As the theoretical resolution (Abbe-limit) of the employed objective lens is about 4 µm, the data acquisition was generally under-sampled and limited by the step size. Because of the time constraints to record Raman data, single-point measurements and Raman image acquisitions of smaller areas were performed. Figure 1 shows examples of OCT images of the abovementioned dimensions. Figure 1(A) represents a C-scan image with noticeable abnormal inclusions at the indicated position (red arrow). Row B in Fig. 1 shows representative B scans of the positions P1-3 that are indicated in Fig. 1(A). The deposition of about 0.25 mm in diameter that is approximately 0.5 mm below the aorta surface is easily observable. Position P3 is an example with no noticeable inclusions. At the employed OCT resolution, the morphology of the aorta wall is well resolved, and the penetration depth of the B scan is about 1.5 mm. Apart from the identified deposition, the morphology exhibits loose organization of connective tissue at the indicated positions (white arrows). The OCT image acquisition took less than 10 s. After successful OCT/Raman image recording, the aorta sample was sectioned for microscopic histology examinations. The histology sections corresponding to the B-scan positions shown in row B are presented in row C. This confirms the loose structure of fibril in connective tissue on the aorta wall. Importantly, the abnormal inclusion was identified as a crystalline calcium deposition.

Figure 1.(Color online) Examples of OCT images of an aorta area with calcified depositions and a comparison with histology of the same region. (A) An OCT C-scan image of a area with large inclusions. (B) Representative B scans of the positions indicated in (A). P1 and P2 show obvious calcification, which was confirmed by histopathology shown in row (C). P3 does not show significant inclusions. The scale bar in (B) is 1 mm.
Figure 2(A) shows an OCT image of the investigated area overlaid with the projected Raman image generated post acquisition by a spectral unmixing algorithm (N-FINDR), as well as a K-means clustering algorithm. The dimensions of the Raman image are at a step size related resolution of 100 µm. An OCT top view B scan of the area at the center of the intra-arterial deposition, approximately 0.5 mm below the surface of the arterial wall, is shown in Fig. 2(B). The Raman images presented in Figs. 2(C) and 2(E) were reconstructed using a vertex component and K-means clustering algorithm, respectively. The corresponding Raman spectra are plotted in corresponding colors in Figs. 2(D) and 2(F). Both algorithms clearly identify three different regions within the area of interest indicated by the red square. The corresponding Raman spectra show Raman bands that are typical for proteins, as well as calcium phosphate. For the N-FINDR algorithm, the calcification is plotted in green, and, for the K means, it is in red. The spectral information associated with the regions shown in Figs. 2(D) and 2(F) both exhibit a very strong and sharp calcium phosphate peak located at . Calcium phosphate is the main inorganic component found in calcifications of the arteries, whereby the scattering intensities are caused by symmetric vibrations of the anionic phosphate. The areas around the calcification shown in blue colors are mainly composed of the connective tissue of the surrounding aorta. The corresponding spectra show main protein features at 1650 and , associated with carbonyl stretches of the peptide bonds of the protein backbones and deformations of the peptide residues, respectively. Significant amounts of lipids, such as cholesterol or triglycerides could not be observed, which is manifested in the band positions of the two mentioned Raman bands generally found at slightly lower wavenumbers around 1650 and for lipids.
Figure 2.(Color online) OCT and Raman images of the calcified plaque deposition also shown in Figure 1. (A) and (B) OCT C and B scans of the aorta wall, whereby (B) shows the top view. The corresponding Raman images and the associated Raman spectra are shown in (C) and (D), as well as (E) and (F) for a value chain analysis (VCA) and K-means cluster analysis, respectively.
The combination of an OCT-Raman microscopy setup, which can operate in the imaging mode, clearly identified areas of calcification within an arterial wall affected by atherosclerosis. Investigating an ex vivo coronary artery was to test the potential of Raman spectroscopy using the preliminary step so that the sample signatures can be visualized, employing a microscopic setup in order to explore the full spectral contribution. Frequently during specialized catheter manufacture, many other factors might hinder the spectral contribution and would result in a false statement. Our next step would be to convert this system into a catheter setup. Initially, it is required to have a broad idea of the amount of signals and shapes of Raman spectral contributions of an aorta embedded with plaque. A flexible catheter that can be inserted into arteries would the ideal for this application. So far, no focusing optics are available that can be used for intravascular applications. However, it will be one of the prominent questions to answer with regard to whether it is necessary or not. One of the key issues is always the penetration depth of Raman spectroscopy, regardless of the use of confocal or dispersive approaches.
In comparison with established NIR spectroscopy, Raman spectra, in general, are far richer with regard to their analytical chemical information. Within the NIR, only very broad overtones are observed that usually lack specificity. NIRS can detect or distinguish lipids from their protein/vessel wall environment, but cannot detect any inorganic contributions. A plus of the infrared applications is the time frame of the data acquisition. In the NIR, water is also not problematic.
In conclusion, the OCT scans deliver very clear images of the morphology of the atherosclerotic inclusions, as well as for the surrounding tissue. Usually atherosclerotic plaque depositions exhibit a higher refractive index compared to the connective tissue of normal vessel walls of aortas. The surrounding tissue also shows areas of lower OCT intensity, indicating a generally unorganized tissue structure. The areas with apparent depositions are subsequently analyzed by Raman mapping. The acquired Raman images correlate very well with the depositions in the areas identified by OCT. The composition of the individual plaques is unambiguously analyzed as calcium phosphate. All investigated depositions of that sample show the same characteristics. The penetration depth of the OCT can be estimated to be between 1 and 1.5 mm into the aortal tissue. The depositions are usually found around 0.5 mm below the surface. The penetration depth of the Raman scans is undoubtedly high enough to record spectra with a sufficient signal-to-noise ratio to clearly identify the depositions as crystalline calcium and the surrounding as connective tissue without significant amounts of lipids present. Important to note at that point is that areas with high abundances of blood coagulates do not give any measurable Raman signal, but show strong fluorescence backgrounds, which is not surprising because of the high amounts of chromophores in blood. Fresh blood, on the other hand, usually does not disturb the recording of Raman spectra, as hemoglobin rather gives rise to resonance Raman effects. The maximum penetration depth of the current setup is difficult to estimate for biological samples, as the composition is usually heterogeneous, and the refractive index of the tissue in focus influences the penetration. The penetration depth also depends on many measurement parameters, for instance, the laser power, wavelength, and integration time. The maximum resolution with an objective lens numerical aperture of 0.11 generates a volume with a focal spot diameter of about 4 µm laterally and approximately 9 µm in the z direction. For the current setup for an excitation of 785 nm, the time frame of 1 s per spectrum at a laser power of ca. 10 mW at the laser focus is comparable to similar experiments previously reported and potentially applicable to in vivo conditions[12,13,25].
References
[1] Global atlas on cardiovascular disease prevention and control(2011).
[2] S. Barquera, A. Pedroza-Tobías, C. Medina, L. Hernández-Barrera, K. Bibbins-Domingo, R. Lozano, A. Moran. Arch. Med. Res., 46, 328(2015).
[3] R. Virmani, J. Narula, M. Leon, J. Willerson. The Vulnerable Atherosclerotic Plaque: Strategies for Diagnosis and Management(2007).
[4] M. Naghavi, P. Libby, E. Falk, S. Casscells, S. Litovsky, J. Rumberger, J. Badimon, C. Stefanadis, P. Moreno, G. Pasterkamp, Z. Fayad, P. Stone, S. Waxman, P. Raggi, M. Madjid, A. Zarrabi, A. Burke, C. Yuan, P. Fitzgerald, D. Siscovick, C. L. de Korte, M. Aikawa, K. Airaksinen, G. Assmann, C. Becker, J. Chesebro, A. Farb, Z. Galis, C. Jackson, I. Jang, W. Koenig, R. Lodder, K. March, J. Demirovic, M. Navab, S. Priori, M. Rekhter, R. Bahr, S. Grundy, R. Mehran, A. Colombo, E. Boerwinkle, C. Ballantyne, W. J. Insull, R. Schwartz, R. Vogel, P. Serruys, G. Hansson, D. Faxon, S. Kaul, H. Drexler, P. Greenland, J. Muller, R. Virmani, P. Ridker, D. Zipes, P. Shah, J. Willerson. Circulation, 108, 1664(2003).
[5] V. Neumeister, M. Scheibe, P. Lattke, W. Jaross. Atherosclerosis, 165, 251(2002).
[6] J. Caplan, S. Waxman, R. Nesto, J. Muller. J. Am. Coll. Cardiol., 18, C92(2005).
[7] C. Bourantas, F. Jaffer, F. Gijsen, G. van Soest, S. Madden, B. Courtney, A. Fard, E. Tenekecioglu, Y. Zeng, A. van der Steen, S. Emelianov, J. Muller, P. Stone, L. Marcu, G. Tearney, P. Serruys. Eur. Heart J., 38, 400(2017).
[8] S. Kang, G. Mintz, J. Pu, S. Sum, S. Madden, A. Burke, K. Xu, J. Goldstein, G. Stone, J. Muller, R. Virmani, A. Maehara. JACC Cardiovasc. Imaging., 8, 184(2015).
[9] K. Huynh. Nat. Rev. Cardiol., 12, 130(2015).
[10] S. van de Poll, T. Römer, G. Puppels, A. van der Laarse. J. Cardiovasc. Risk., 9, 255(2002).
[11] H. P. Buschman, E. T. Marple, M. L. Wach, B. Bennett, T. C. Schut, H. A. Bruining, A. V. Bruschke, A. van der Laarse, G. J. Puppels. Anal. Chem., 72, 3771(2000).
[12] J. T. Motz, M. Fitzmaurice, A. Miller, S. J. Gandhi, A. S. Haka, L. H. Galindo, R. R. Dasari, J. R. Kramer, M. S. Feld. J. Biomed. Opt., 11, 021003(2006).
[13] C. Matthäus, S. Dochow, G. Bergner, A. Lattermann, B. F. Romeike, E. T. Marple, C. Krafft, B. Dietzek, B. R. Brehm, J. Popp. Anal Chem, 84, 7845(2012).
[14] C. Matthäus, R. Cicchi, T. Meyer, A. Lattermann, M. Schmitt, B. Romeike, C. Krafft, B. Dietzek, B. Brehm, F. Pavone, J. Popp. J. Innov. Opt. Heal Sci., 7, 1450027(2014).
[15] E. E. Golub. Biochim. Biophys. Acta, 1790, 1592(2009).
[16] S. Dochow, D. Ma, I. Latka, T. Bocklitz, B. Hartl, J. Bec, H. Fatakdawala, E. Marple, K. Urmey, S. Wachsmann-Hogiu, M. Schmitt, L. Marcu, J. Popp. Anal. Bioanal. Chem., 407, 8291(2016).
[17] I. Bratchenko, D. Artemyev, O. Myakinin, Y. Khristoforova, A. Moryatov, S. Kozlov, V. Zakharov. J. Biomed. Opt., 22, 027005(2017).
[18] A. Meher, Y.-C. Chen. Anal. Chem., 88, 9151(2016).
[19] K. Egodage, S. Dochow, T. Bocklitz, O. Chernavskaia, C. Matthäus, M. Schmitt, J. Popp. J. Biomed. Photon. Eng., 1, 169(2015).
[20] J. Izatt, M. Choma. Theory of Optical Coherence Tomography, Optical Coherence Tomography(2008).
[21] C. Ryan, E. Clayton, W. Griffin, S. Sie, D. Cousens. Nucl. Instrum Methods Phys. Res. B., 34, 396(1988).
[22] M. Winter. Proc. SPIE, 3753, 266(1999).
[23] M. Hedegaard, C. Matthäus, S. Hassing, C. Krafft, M. Diem, J. Popp. Theory Chem. Acc., 130, 1249(2011).
[24] C. Beleites, V. Sergo. ‘hyperSpec: a package to handle hyperspectral data sets in R.’, R package version 098-20150304(2016).
[25] O. R. Sćepanović, M. Fitzmaurice, A. Miller, C. R. Kong, Z. Volynskaya, R. R. Dasari, J. R. Kramer, M. S. Feld. J. Biomed. Opt., 16, 011009(2011).