
Renjing Chen, Wenqiang Xu, Yehong Tan, Yufei Guo, Chuanhou Ding, Donglin Ma. Path Correlation Phase Unwrapping Algorithm by Regional Judgement[J]. Laser & Optoelectronics Progress, 2019, 56(16): 161007
- Laser & Optoelectronics Progress
- Vol. 56, Issue 16, 161007 (2019)
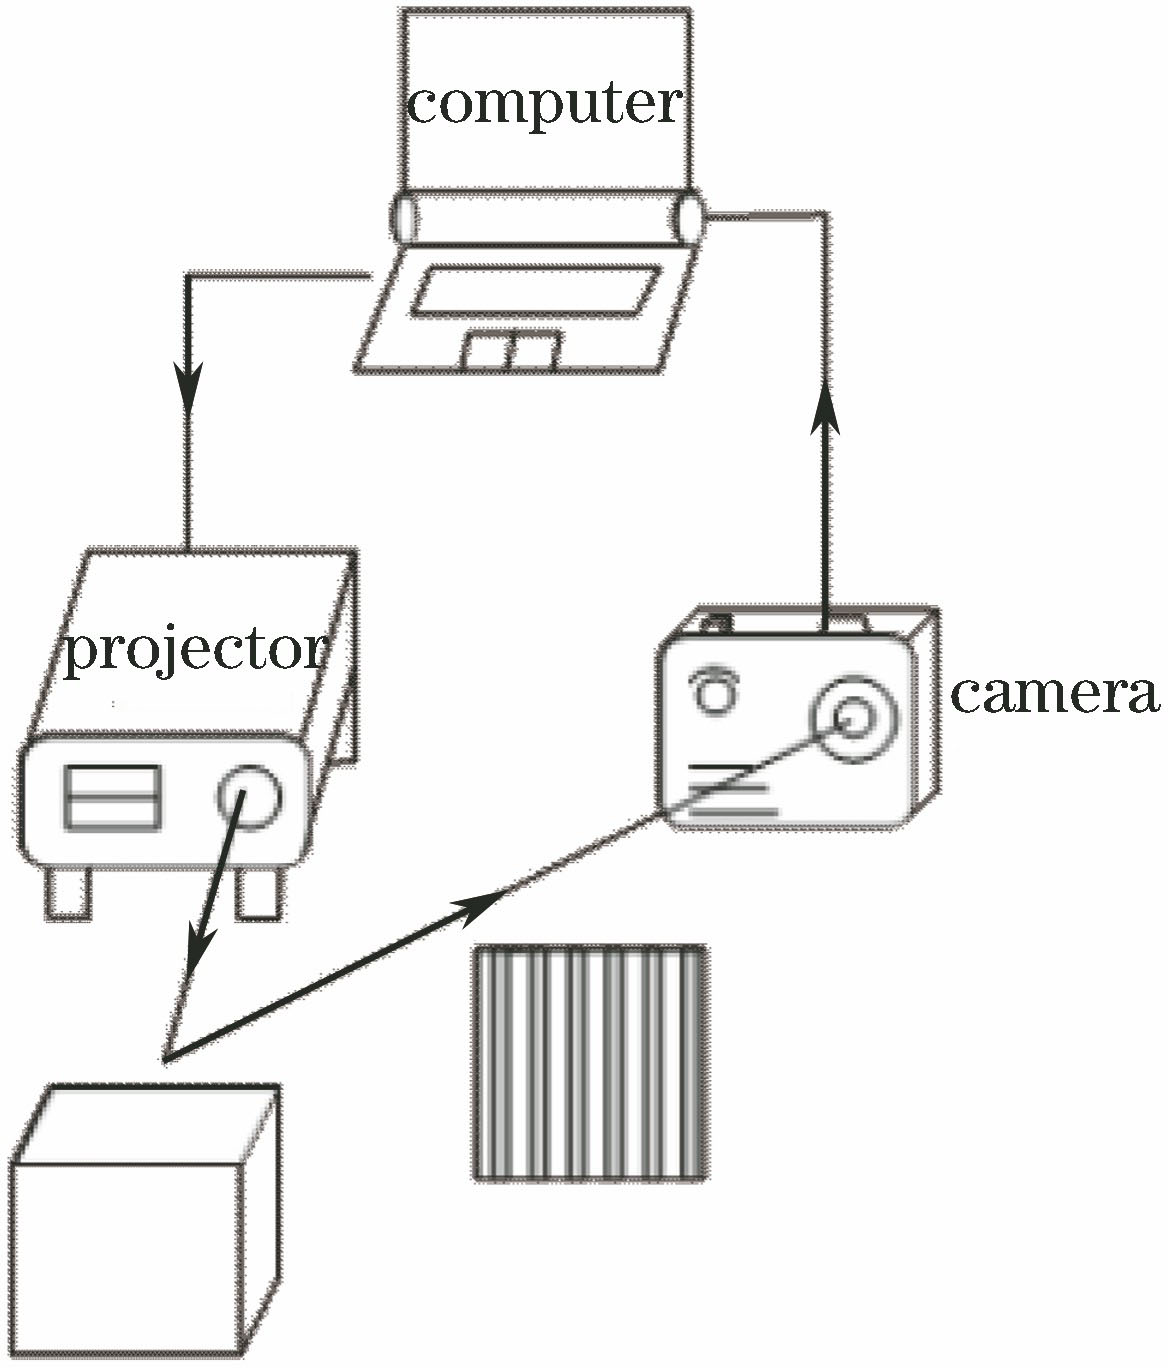
Fig. 1. Flow chart of imaging
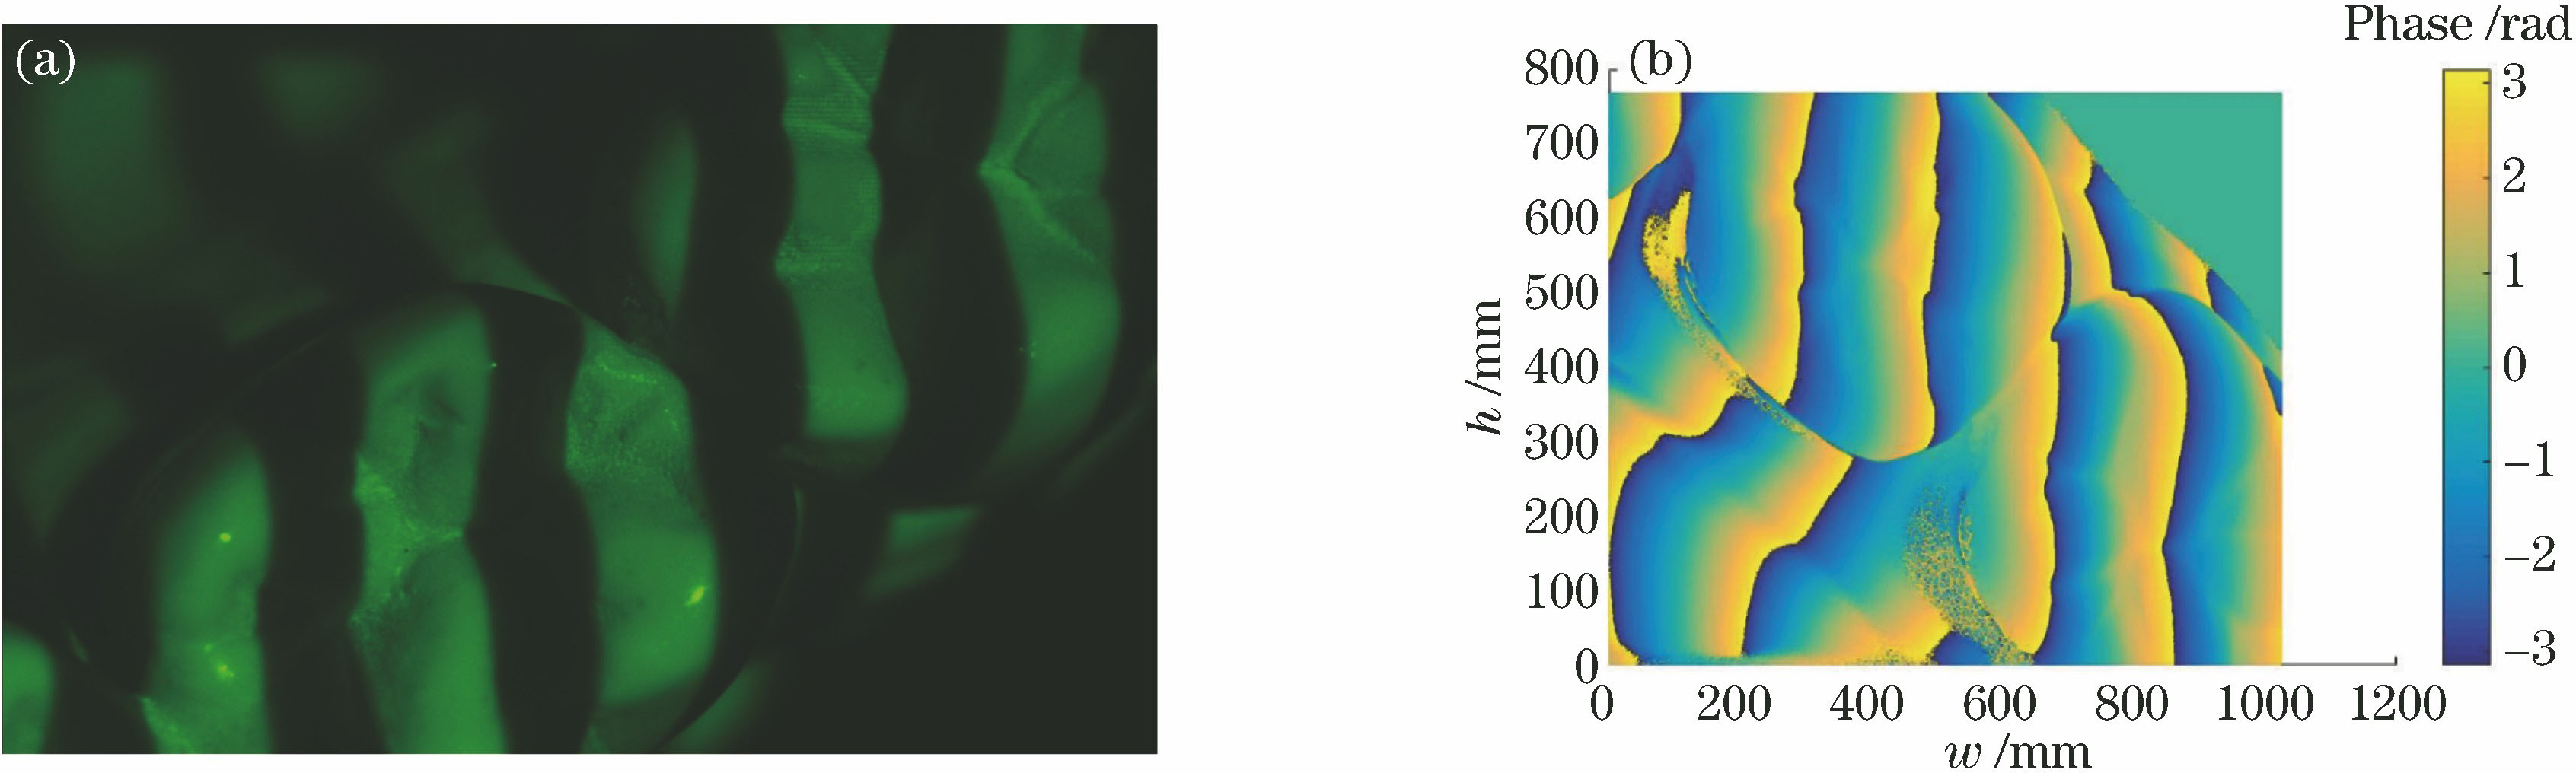
Fig. 2. Fringe projection picture and original phase image. (a) Fringe projection picture of teeth;(b) original phase image
Fig. 3. Results of twice reconstruction. (a) Phase image of first time reconstruction; (b) phase image of second time reconstruction
Fig. 4. Results of twice reconstruction after transposition. (a) Phase image of third time reconstruction; (b) phase image of forth time reconstruction
Fig. 5. Final results. (a) Top view of final result; (b) 3D image of final result
Fig. 6. Results of least square method. (a) Top view rebulided by least square method; (b) 3D image rebulided by least square method
Fig. 7. Results of weighted least square method. (a) Top view rebulided by weighted least square method; (b) 3D image rebulided by weighted least square method
Fig. 8. Wrapped phase image and rewrapped phase image of regional judgement. (a) Wrapped phase image; (b) rewrapped phase image of regional judgement
Fig. 9. Wrapped phase image and rewrapped phase image of least square method. (a) Wrapped phase image; (b) rewrapped phase image of least square method
Fig. 10. Wrapped phase image and rewrapped phase image of weighted least square method. (a) Wrapped phase image; (b) rewrapped phase image of weighted least square method
Fig. 11. First case. (a) Fringe projection picture; (b) rebuilded 3D image
Fig. 12. Second case. (a) Fringe projection picture; (b) rebuilded 3D image
Fig. 13. Third case. (a) Fringe projection picture; (b) rebuilded 3D image
|
Table 1. Error average value and error standard deviation of error matrix

Set citation alerts for the article
Please enter your email address
© Copyright 2018-2021 | Chinese Laser Press. All Rights Reserved 沪ICP备15018463号-20