• Acta Optica Sinica
  • Vol. 40, Issue 3, 0328001 (2020)
Chengbin Xing, Xingsheng Deng*, and Kang Xu
Author Affiliations
  • Department of Surveying and Mapping Engineering, School of Traffic & Transportation Engineering, Changsha University of Science and Technology, Changsha, Hunan 410004, China
  • show less
    DOI: 10.3788/AOS202040.0328001 Cite this Article Set citation alerts
    Chengbin Xing, Xingsheng Deng, Kang Xu. Improved Moving Surface Algorithm Based on Confidence Interval Estimation Theory[J]. Acta Optica Sinica, 2020, 40(3): 0328001 Copy Citation Text show less
    Creating map area based on coordinate extreme values
    Fig. 1. Creating map area based on coordinate extreme values
    Established grid index diagram
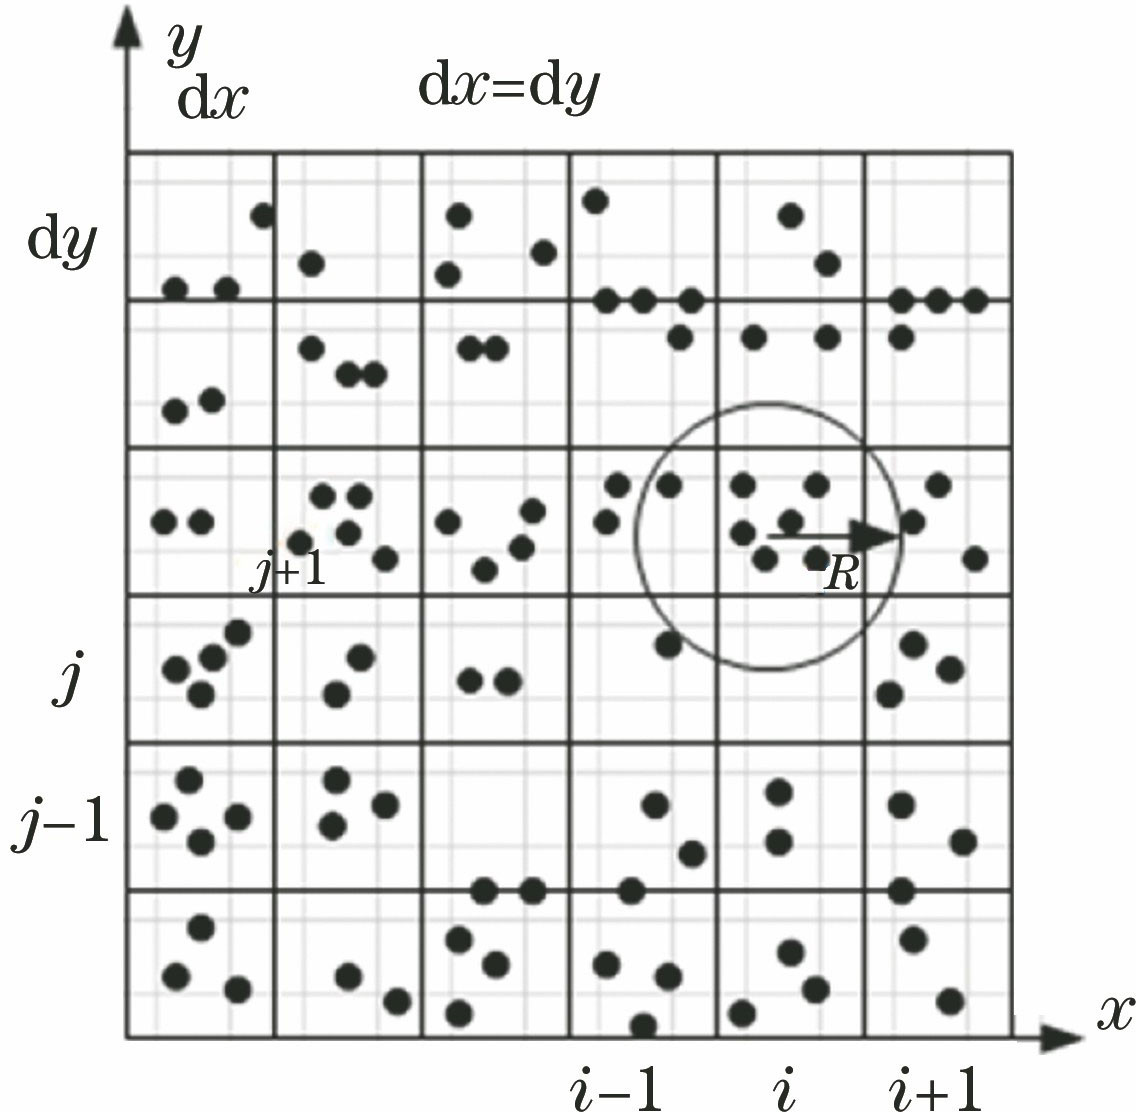
    Fig. 2. Established grid index diagram
    Distribution of seed points in small grid
    Fig. 3. Distribution of seed points in small grid
    Quadric surface fitted by seed points in small grid
    Fig. 4. Quadric surface fitted by seed points in small grid
    Index grids
    Fig. 5. Index grids
    Small grid in large grid
    Fig. 6. Small grid in large grid
    Distances between other points and plane ΔACD
    Fig. 7. Distances between other points and plane ΔACD
    Distances between other points and plane ΔADE
    Fig. 8. Distances between other points and plane ΔADE
    Flow chart of improved filtering algorithm
    Fig. 9. Flow chart of improved filtering algorithm
    Distribution of feature points and ground points before filtering
    Fig. 10. Distribution of feature points and ground points before filtering
    Ground point distribution after filtering
    Fig. 11. Ground point distribution after filtering
    Ground point distribution of elevation difference between real terrain and fitted terrain
    Fig. 12. Ground point distribution of elevation difference between real terrain and fitted terrain
    Distribution of feature points and ground points under threshold conditions
    Fig. 13. Distribution of feature points and ground points under threshold conditions
    Distribution of feature points and ground points of Sample41 before filtering
    Fig. 14. Distribution of feature points and ground points of Sample41 before filtering
    Ground point distribution of Sample41 after filtering
    Fig. 15. Ground point distribution of Sample41 after filtering
    Distribution of elevation difference between real terrain and fitted terrain of Sample41
    Fig. 16. Distribution of elevation difference between real terrain and fitted terrain of Sample41
    Distribution of Sample41 feature points and ground points under threshold condition
    Fig. 17. Distribution of Sample41 feature points and ground points under threshold condition
    Ground point distribution after filtering by improved moving surface algorithm
    Fig. 18. Ground point distribution after filtering by improved moving surface algorithm
    Distribution of ground points after filtering by classical moving surface algorithm
    Fig. 19. Distribution of ground points after filtering by classical moving surface algorithm
    Test dataSampleTopographical feature
    Site1Sample11Vegetation and buildings on steep slopes
    Sample12Buildings and small objects on the ground
    Sample21Narrow bridge
    Site2Sample22Bridge
    Sample23Complex buildings, discontinuous terrain
    Sample24Steep slopes and vegetation
    Site3Sample31There is a low value noise point
    Site4Sample41Discontinuous terrain
    Sample42High frequency terrain relief
    Sample51Vegetation on the slope
    Site5Sample52Steep slope
    Sample53Discontinuous terrain
    Sample54Village
    Site6Sample61Discontinuous steep slope
    Site7Sample71Bridge
    Site8No sampleIntermittent terrain, ridge
    Table 1. Test dataset and sample attributes released by ISPRS
    SampleFiltered dataSample data point
    Ground pointFeature point
    Ground pointabe=a+b
    Feature pointcdf=c+d
    Filtered pointg=a+ch=b+dm=a+b+c+d
    Table 2. Definition of filter error
    TestdataSample11Sample23Sample41Sample51Sample53
    Sample attributeVegetation and buildings on steep slopesComplex buildingAggregate low value pointsLow vegetation, steep slope, ridgeIntermittent terrain
    Number of sample points3801025095112311784534378
    Filtered feature point185761310949081287828324
    Filtered ground point1943411986632349676054
    Type I error /%17.8016.3713.439.7314.50
    Type II error /%4.128.7210.307.318.52
    Total error /%11.909.0812.358.4114.20
    Table 3. Number of ground and non-ground points in the sample survey area and three types of error ratio
    Data sampleType of errorPTD algorithmMorphological algorithmMoving surface algorithmOur algorithm
    Type I error15.9621.9721.5217.80
    Sample11Type II error3.653.165.954.12
    Total error10.7617.3614.8711.90
    Type I error12.0813.3018.3916.37
    Sample23Type II error3.8114.909.028.72
    Total error8.2214.1014.729.08
    Type I error8.5812.5312.2314.50
    Sample53Type II error16.7614.2342.778.52
    Total error8.9112.6017.7114.20
    Type I error7.1522.431.841.87
    Sample61Type II error0.170.946.795.43
    Total error6.9121.682.011.99
    Table 4. Comparison of accuracies of 4 filter algorithms%
    Type of errorImproved moving surface algorithmClassical moving surface algorithm
    Type I error9.7311.23
    Type II error7.319.34
    Total error8.4110.27
    Table 5. Statistics of three types of error of improved algorithm and classical algorithm for Sample51%
    Chengbin Xing, Xingsheng Deng, Kang Xu. Improved Moving Surface Algorithm Based on Confidence Interval Estimation Theory[J]. Acta Optica Sinica, 2020, 40(3): 0328001
    Download Citation