Author Affiliations
College of Metrology and Measurement Engineering, China Jiliang University, Hangzhou, Zhejiang 310018, Chinashow less
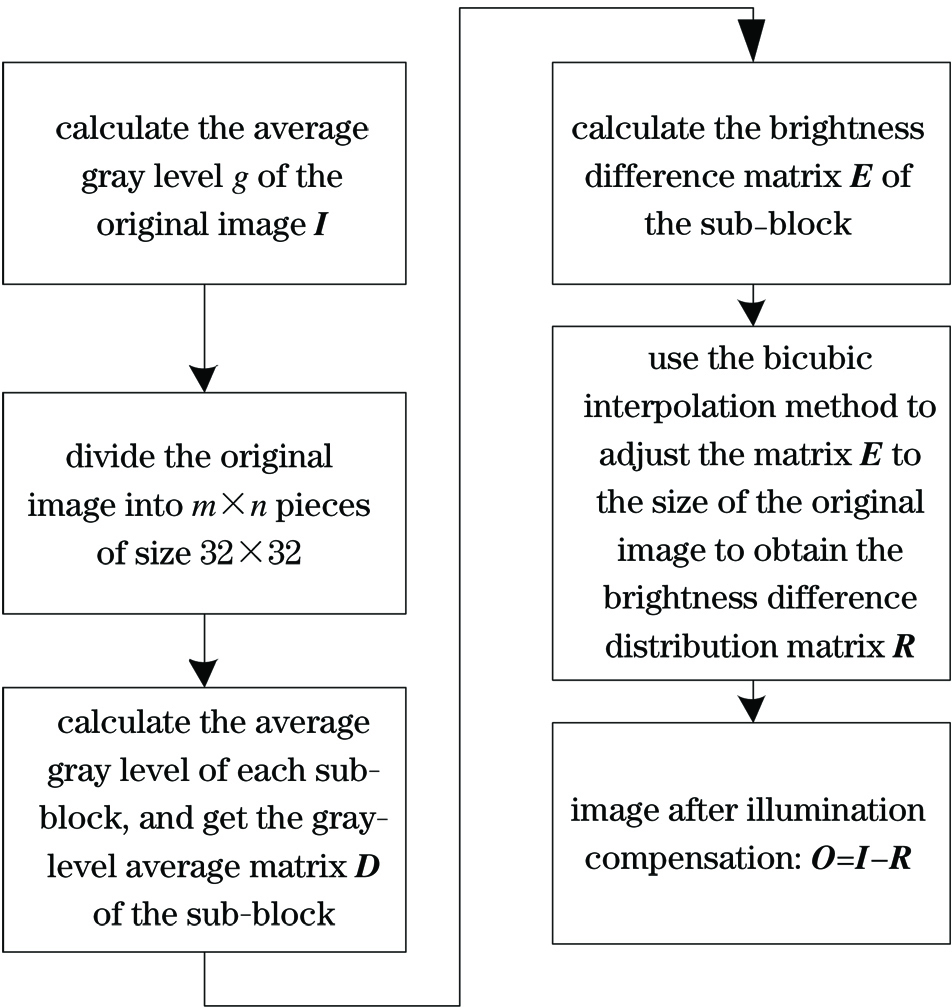
Fig. 1. Flowchart of uneven illumination compensation algorithm
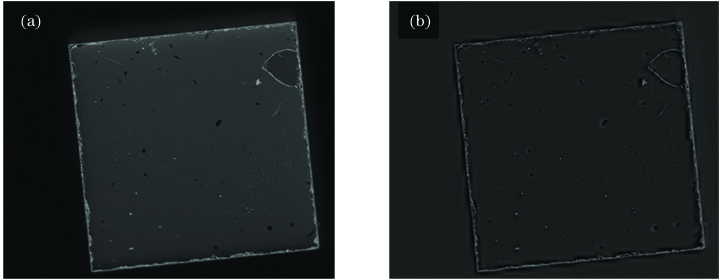
Fig. 2. Comparison of components before and after illumination compensation. (a) Before illumination compensation; (b) after illumination compensation
Fig. 3. Edge extraction of optical element. (a) Original image; (b) Otsu threshold segmentation; (c) edge expansion; (d) edge corrosion; (e) region segmentation
Fig. 4. Comparison of edge extraction results
Fig. 5. Target detection results
Fig. 6. Calibration plate and calibration lines. (a) Calibration plate; (b) vertical calibration line; (c) horizontal calibration line
Fig. 7. Software measurement process
Fig. 8. Software interface of optical component dimension measurement
Fig. 9. Flow chart of optical element size measurement
Fig. 10. Optical element size measuring system
| Item | Vertical calibration line spacing/mm | Horizontal calibration line spacing/mm |
|---|
| 1 | 1.9211 | 1.7527 | | 2 | 1.9205 | 1.7494 | | 3 | 1.9232 | 1.7491 | | 4 | 1.9214 | 1.7551 | | 5 | 1.9233 | 1.7531 | | Mean value | 1.9219 | 1.7519 |
|
Table 1. Calibration line spacing
| Item | Otsu method | Canny operator edge detection algorithm | Otsu algorithm based on region segmentation |
|---|
| Length/mm | Width/mm | Length/mm | Width/mm | Length/mm | Width/mm |
|---|
| 1 | 1.4599 | 1.4559 | 1.4891 | 1.4782 | 1.4638 | 1.4550 | | 2 | 1.4872 | 1.4603 | 1.6697 | 1.4977 | 1.4639 | 1.4516 | | 3 | 1.4601 | 1.4578 | 1.4868 | 1.4855 | 1.4656 | 1.4617 | | 4 | 1.4597 | 1.1703 | 1.4868 | 1.4778 | 1.4611 | 1.4575 | | 5 | 1.4601 | 1.4562 | 1.4860 | 1.4783 | 1.4618 | 1.4516 | | 6 | 1.4567 | 1.4526 | 1.4821 | 1.4750 | 1.4628 | 1.4595 | | 7 | 1.4582 | 1.4445 | 1.6530 | 1.4783 | 1.4648 | 1.4546 | | 8 | 1.4571 | 1.0586 | 1.4818 | 1.4567 | 1.4642 | 1.4585 | | 9 | 1.4573 | 1.4540 | 1.4827 | 1.4673 | 1.4616 | 1.4590 | | 10 | 1.4572 | 1.4544 | 1.4915 | 1.4815 | 1.4633 | 1.4581 |
|
Table 2. Measurement results of optical components for size
| Item | Length/mm | Width/mm |
|---|
| 1 | 1.4635 | 1.4606 | | 2 | 1.4630 | 1.4608 | | 3 | 1.4633 | 1.4586 | | 4 | 1.4614 | 1.4599 | | 5 | 1.4605 | 1.4606 | | Mean value | 1.4623 | 1.4601 |
|
Table 3. Results of measuring size for optical components obtained by digital length gauge
| Item | Otsu method | Canny operator edge detection algorithm | Otsu algorithm based on region segmentation |
|---|
| Length | Width | Length | Width | Length | Width |
|---|
| Absolute error/μm | Relative error/% | Absolute error/μm | Relative error/% | Absolute error/μm | Relative error/% | Absolute error/μm | Relative error/% | Absolute error/μm | Relative error/% | Absolute error/μm | Relative error/% | | 1 | -2.4 | -0.16 | -4.2 | -0.29 | 26.8 | 1.83 | 18.1 | 1.24 | 1.5 | 0.10 | -5.1 | -0.35 | | 2 | 24.9 | 1.70 | 0.2 | 0.01 | 207.4 | 14.18 | 19.8 | 1.36 | 1.6 | 0.11 | -8.5 | -0.58 | | 3 | -2.2 | -0.15 | -2.3 | -0.16 | 24.5 | 1.68 | 25.4 | 1.74 | 3.3 | 0.23 | 1.6 | 0.11 | | 4 | -2.6 | -0.18 | -289.8 | -19.85 | 24.5 | 1.68 | 17.7 | 1.21 | -1.2 | -0.08 | -2.6 | -0.18 | | 5 | -2.2 | -0.15 | -3.9 | -0.27 | 23.7 | 1.62 | 18.2 | 1.25 | -0.5 | -0.03 | -8.5 | -0.58 | | 6 | -5.6 | -0.38 | -7.5 | -0.51 | 19.8 | 1.35 | 14.9 | 1.02 | 0.5 | 0.03 | -0.6 | -0.04 | | 7 | -4.1 | -0.28 | -15.6 | -1.07 | 190.7 | 13.04 | 18.2 | 1.25 | 2.5 | 0.17 | -5.5 | -0.38 | | 8 | -5.2 | -0.36 | -401.5 | -27.50 | 19.5 | 1.33 | -3.4 | -0.23 | 1.9 | 0.13 | -1.6 | -0.11 | | 9 | -5.0 | -0.34 | -6.1 | -0.42 | 20.4 | 1.40 | 7.2 | 0.49 | -0.7 | -0.05 | -1.1 | -0.08 | | 10 | -5.1 | -0.35 | -5.7 | -0.39 | 29.2 | 2.00 | 24.1 | 1.47 | 1.0 | 0.07 | -2.0 | -0.14 |
|
Table 4. Error analysis for measuring size of machine vision
| Item | Filter 1 | Filter 2 |
|---|
| Length/mm | Width/mm | Length/mm | Width/mm |
|---|
| 1 | 1.3974 | 1.0005 | 1.4003 | 0.7491 | | 2 | 1.3964 | 0.9992 | 1.3996 | 0.7475 | | 3 | 1.3969 | 1.0008 | 1.3944 | 0.7488 | | 4 | 1.3992 | 1.0017 | 1.3986 | 0.7486 | | 5 | 1.4069 | 1.0009 | 1.4001 | 0.7505 | | Mean value | 1.3994 | 1.0006 | 1.3986 | 0.7489 |
|
Table 5. Results for measuring the size of two kinds of optical elements using digital length gauge
| Item | Filter 1 | Filter 2 |
|---|
| Length | Width | Length | Width |
|---|
| Measured size/mm | Absolute error /μm | Relative error/% | Measured size /mm | Absolute error /μm | Relative error/% | Measuredsize /mm | Absolute error /μm | Relative error/% | Measured size /mm | Absolute error /μm | Relative error/% | | 1 | 1.3906 | -8.8 | -0.63 | 1.0032 | 2.8 | 0.28 | 1.3908 | -7.8 | -0.56 | 0.7452 | -3.7 | -0.49 | | 2 | 1.3941 | -5.3 | -0.38 | 1.0027 | 2.3 | 0.23 | 1.3902 | -8.4 | -0.60 | 0.7445 | -4.4 | -0.59 | | 3 | 1.3940 | -5.4 | -0.39 | 1.0054 | 5.0 | 0.50 | 1.4018 | 3.2 | 0.23 | 0.7432 | -5.7 | -0.76 | | 4 | 1.3929 | -6.5 | -0.46 | 1.0031 | 2.7 | 0.27 | 1.4072 | 8.6 | 0.61 | 0.7500 | 1.1 | 0.15 | | 5 | 1.4025 | 3.1 | 0.22 | 1.0065 | 6.1 | 0.61 | 1.4079 | 9.3 | 0.66 | 0.7487 | -0.2 | -0.03 |
|
Table 6. Measurement results and error analysis of component size