• Spectroscopy and Spectral Analysis
  • Vol. 42, Issue 7, 2262 (2022)
Qing HUANG1、1;, He-ru XUE1、1; *;, Jiang-ping LIU1、1; *;, Mei-chen LIU1、1;, Peng-wei HU1、1;, and De-gang SUN2、2;
Author Affiliations
  • 11. College of Computer and Information Engineering, Inner Mongolia Agricultural University, Huhhot 010000, China
  • 22. College of Information Engineering, Shangdong HuaYu University of Technology, Dezhou 253000, China
  • show less
    DOI: 10.3964/j.issn.1000-0593(2022)07-2262-07 Cite this Article
    Qing HUANG, He-ru XUE, Jiang-ping LIU, Mei-chen LIU, Peng-wei HU, De-gang SUN. Spectral Selection Method Based on Ant Colony-Genetic Algorithm[J]. Spectroscopy and Spectral Analysis, 2022, 42(7): 2262 Copy Citation Text show less
    Original spectra of samples of six different brands(a): Yilizhennong; (b): Yiliskim milk; (c): Mengniu high calcium milk; (d): QQ star; (e): The land; (f): Telunsu
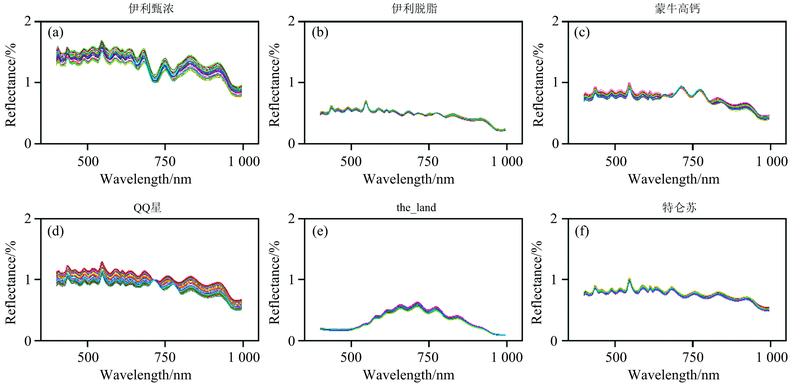
    Fig. 1. Original spectra of samples of six different brands
    (a): Yilizhennong; (b): Yiliskim milk; (c): Mengniu high calcium milk; (d): QQ star; (e): The land; (f): Telunsu
    PLS-ACO-GA algorithm flowchart
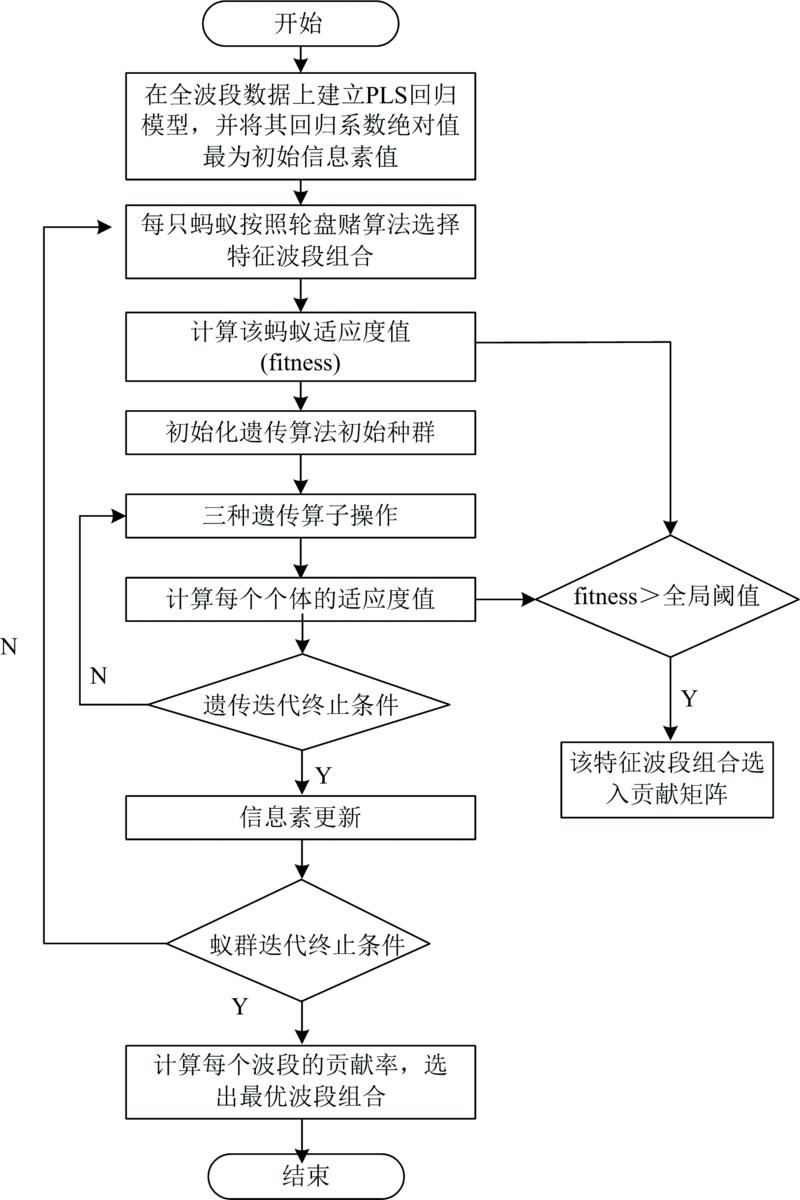
    Fig. 2. PLS-ACO-GA algorithm flowchart
    PLS-ACO band contributionrate
    Fig. 3. PLS-ACO band contributionrate
    PLS-ACO-GA band contributionrate
    Fig. 4. PLS-ACO-GA band contributionrate
    MSC-(PLS-ACO-GA)-RF prediction results
    Fig. 5. MSC-(PLS-ACO-GA)-RF prediction results
    预处理方法Rc2Rp2RMSECVRMSEP
    Raw data0.999 10.987 30.046 60.143 7
    1st Der0.998 30.973 60.064 70.207 4
    2st Der0.999 10.954 60.046 70.270 0
    S-G0.998 80.988 80.053 40.135 1
    MSC0.999 90.993 40.015 50.103 8
    SNV0.999 00.988 00.049 40.139 6
    Table 1. The prediction results of the PLS regression model for the milk fat content of different pretreatment methods
    max-features波长数Rp2RMSEP主成分数
    Full1250.993 40.103 824
    10210.996 20.077 810
    20180.997 00.069 216
    30410.997 80.058 512
    Table 2. PLS regression model results with PLS-ACO and max-features set to 10, 20 and 30 respectively
    max-features波长数Rp2RMSEP主成分数
    Full1250.934 40.103 824
    10160.996 80.075 28
    20160.997 60.062 214
    30320.998 00.056 512
    Table 3. PLS regression model results with PLS-ACO-GA and max-features set to 10, 20 and 30 respectively
    方法波长数Rp2RMSEP主成分数
    Full1250.934 40.103 824
    CARS400.995 10.088 712
    GA430.997 10.068 514
    ACO220.996 20.072 812
    PLS-ACO180.997 00.077 816
    PLS-ACO-GA160.997 60.062 214
    Table 4. PLS regression model result sunder different feature selection methods
    方法波长数Rp2RMSEP
    Full-MLR1250.991 40.118 0
    PLS-ACO-MLR180.997 00.069 2
    PLS-ACO-GA-MLR160.997 60.062 3
    Table 5. PLS-ACO and PLS-ACO-GA MLR results
    方法波长数Rp2RMSEP
    Full-RFR1250.999 9630.007 6
    PLS-ACO-RFR180.999 9740.006 4
    PLS-ACO-GA-RFR160.999 9940.003 0
    Table 6. PLS-ACO and PLS-ACO-GA RFR results
    Qing HUANG, He-ru XUE, Jiang-ping LIU, Mei-chen LIU, Peng-wei HU, De-gang SUN. Spectral Selection Method Based on Ant Colony-Genetic Algorithm[J]. Spectroscopy and Spectral Analysis, 2022, 42(7): 2262
    Download Citation