• Journal of Geographical Sciences
  • Vol. 30, Issue 9, 1495 (2020)
Zhenkui GU, Hui FAN*, and Kun YANG
Author Affiliations
  • Yunnan Key Laboratory of International Rivers and Transboundary Eco-Security, Institute of International Rivers and Eco-Security, Yunnan University, Kunming 650091, China
  • show less
    DOI: 10.1007/s11442-020-1795-7 Cite this Article
    Zhenkui GU, Hui FAN, Kun YANG. GIS and DEM based analysis of incision and drainage reorganization of the Buyuan River basin in the upper Lancang-Mekong of China since the Late Pleistocene[J]. Journal of Geographical Sciences, 2020, 30(9): 1495 Copy Citation Text show less
    (a) A geological map of a scale 1:1 million of the Buyuan River basin in the upper Lancang-Mekong (http://www.ngac.org.cn) and (b) Swath profiles of the Digital Elevation Model (DEM)
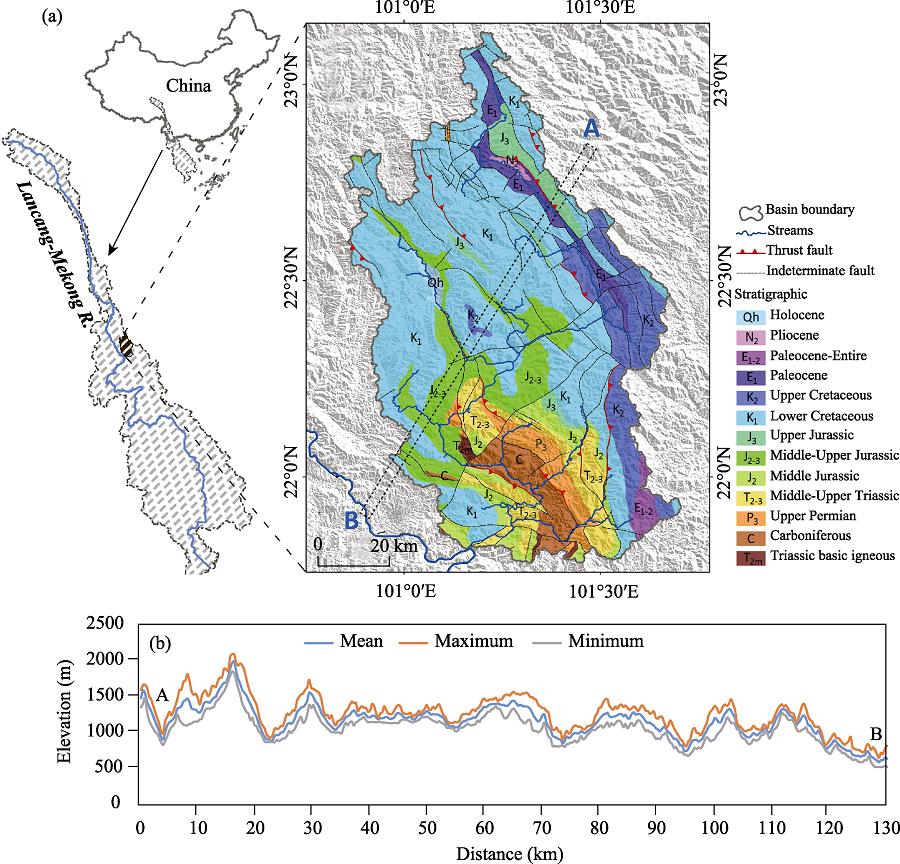
    Fig. 1. (a) A geological map of a scale 1:1 million of the Buyuan River basin in the upper Lancang-Mekong (http://www.ngac.org.cn) and (b) Swath profiles of the Digital Elevation Model (DEM)
    (a) Features of the longitudinal profile of the Buyuan River; (b) Regional dependence of the R*-metric on catchment size A (km2) of the Buyuan River basin. Note: The errors in (a) are due to the overfilling of the depression caused by the horizontal error.
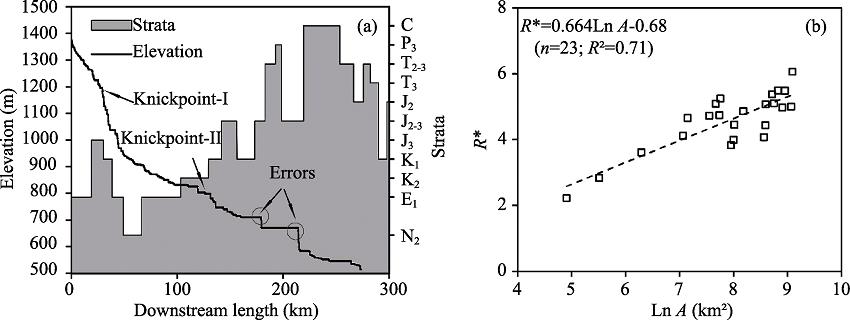
    Fig. 2. (a) Features of the longitudinal profile of the Buyuan River; (b) Regional dependence of the R*-metric on catchment size A (km2) of the Buyuan River basin. Note: The errors in (a) are due to the overfilling of the depression caused by the horizontal error.
    (a) Chi-plots of the local equilibrium reach; (b) Equilibrium longitudinal profiles with θ = 0.43 and the ksn values of 24.75 and 17.25 shown in (a). The coefficient, θ, can be determined according to the optimal linear fitting coefficient (R²) of Chi-plot.
    Fig. 3. (a) Chi-plots of the local equilibrium reach; (b) Equilibrium longitudinal profiles with θ = 0.43 and the ksn values of 24.75 and 17.25 shown in (a). The coefficient, θ, can be determined according to the optimal linear fitting coefficient (R²) of Chi-plot.
    Chi-plot of the Buyuan River basin with A0 = 1 km2 and θ = 0.43. The reference concavity value, θ = 0.43, is the average of the θ-values corresponding to the best linear fitting coefficients (R2) of χ-z profiles of all major channels. Panel (a) shows the distribution of Chi-values and the trend of the river network reorganization in the basin; panel (b) shows two examples of a Chi-plot at the same height difference extracted from (a), and the linear slope represents a steepness difference; panel (c) reflects the longitudinal profiles of the main channel in the basin and the annual precipitation along the mainstream; panel (d) is a three-dimensional remote sensing image of (a).
    Fig. 4. Chi-plot of the Buyuan River basin with A0 = 1 km2 and θ = 0.43. The reference concavity value, θ = 0.43, is the average of the θ-values corresponding to the best linear fitting coefficients (R2) of χ-z profiles of all major channels. Panel (a) shows the distribution of Chi-values and the trend of the river network reorganization in the basin; panel (b) shows two examples of a Chi-plot at the same height difference extracted from (a), and the linear slope represents a steepness difference; panel (c) reflects the longitudinal profiles of the main channel in the basin and the annual precipitation along the mainstream; panel (d) is a three-dimensional remote sensing image of (a).
    Longitudinal profile of the Lancang-Mekong River and its corresponding stream power. The information on the incision rate comes from et al. (2018)" target="_self" style="display: inline;">Zhang et al. (2018). Stream power, Ω = γQs, where γ = 9800 (N/m³), Q = discharge (m³/s), and s = riverbed slope ( et al., 2010" target="_self" style="display: inline;">Pérez-Peña et al., 2010; Das, 2018; et al., 2018" target="_self" style="display: inline;">Gu et al., 2018).
    Fig. 5. Longitudinal profile of the Lancang-Mekong River and its corresponding stream power. The information on the incision rate comes from Zhang et al. (2018). Stream power, Ω = γQs, where γ = 9800 (N/m³), Q = discharge (m³/s), and s = riverbed slope (Pérez-Peña et al., 2010; Das, 2018; Gu et al., 2018).
    Zhenkui GU, Hui FAN, Kun YANG. GIS and DEM based analysis of incision and drainage reorganization of the Buyuan River basin in the upper Lancang-Mekong of China since the Late Pleistocene[J]. Journal of Geographical Sciences, 2020, 30(9): 1495
    Download Citation