Yunnan Key Laboratory of International Rivers and Transboundary Eco-Security, Institute of International Rivers and Eco-Security, Yunnan University, Kunming 650091, China
Zhenkui GU, Hui FAN, Kun YANG. GIS and DEM based analysis of incision and drainage reorganization of the Buyuan River basin in the upper Lancang-Mekong of China since the Late Pleistocene[J]. Journal of Geographical Sciences, 2020, 30(9): 1495
Copy Citation Text
River incision and drainage reorganization have an important impact on the site selection of many major projects including city, road and others, and are the key issues of Quaternary environmental changes. Studies of river incision and river-network adjustment have traditionally been based on extensive field evidence, such as sediment age and beheaded river system. The Buyuan River basin is a large sub-basin of the upper Lancang-Mekong, with high mountains and extremely active erosion. The latter affects the preservation of the Quaternary period sediments leading to difficulties in understanding the main evolution characteristics of the basin. This study investigates differences in the equilibrium state of the longitudinal profile, infers incision rates, and evaluates drainage divide migration timelines using the stream-power incision model, the latest morphological dating, and Chi-plots (χ-z) based on digital elevation models (DEMs) on the GIS software platform. The final results show that two significant erosion base-level decreases occurred in the Late Pleistocene at least. The incision rate of the mainstream might have been 0-2.99 mm/yr since 100 ka BP and 0-3.28 mm/yr since 46 ka BP. The Chi-values across the divides suggest that space limited (or constrained) river reorganization and that there is no severe reorganization in the basin; the imbalance of traceable erosion only exists in local areas. The main driving force for the geomorphologic evolution of the Buyuan River basin is likely climate fluctuations rather than strong tectonic uplift since the Late Pleistocene.
The geomorphologic evolution of catchments is the basis for analyzing the changes in the surface environment. The incision rate and spatiotemporal variation of a river network are core and difficult points in the analysis of geomorphic characteristics given a long-timescale background, which is helpful to understand the historical evolution of a basin and the sediment-contributing area (Demoulin et al., 2017; Wu et al., 2020). The advancement of geochronological techniques has also made it possible to measure the formation ages of river terraces and long-term erosion rates (Guo et al., 2012; Hu et al., 2016; Zhang et al., 2018). Reconstructing ancient channel profiles through river terraces and using sediment dating results to estimate river erosion rates are considered effective methods of achieving this. Common dating methods for sedimentary strata include thermoluminescence (TL), photoluminescence (OSL), electron spin resonance dating (ESR), cosmogenic nuclide (CN), and others (Kreutzer et al., 2018; Roda-Boluda et al., 2019; Su et al., 2019; Tecsa et al., 2020). In recent years, there have been breakthroughs in low-temperature thermochronology, typified by apatite and zircon dating, which have been made, and they have been used in the analysis of plateau residual geomorphology and inversion of paleo-topography (Reiners et al., 2006; Wang et al., 2018). Using these dating methods to determine the age of sediments on landforms such as river terraces, alluvial-flood fans, and fault cliffs, we could reconstruct the formation and evolution history and quantify the erosion rate of landforms (Wu et al., 2020). However, basins in areas with an intense orogenic belt and humid climate have active erosion characteristics in which river valleys are mostly V-shaped and terrace sediments are rarely preserved; thus, the quality and collection process of sediment samples can be adversely affected. Besides, the drainage reorganization in the basin, which is accompanied by river erosion that includes drainage divide migration and river capture (Reiners et al., 2006; Portenga et al., 2011; Singh et al., 2017), is often neglected because of the large spatial scale of the river basin and the sparse field relics, such as beheaded rivers and pirate bays.
The Buyuan River basin, located in the upper Lancang-Mekong, is a large branch basin with such characteristics and is an important source of sediment for Lancang River trunk streams (Gu et al., 2019). For this basin, it is not always possible to fully comprehend the erosion rate of the whole channel by studying river terraces preserved in the local river reaches. The determination of the incision rate of a river and its divide migration are related to the stable evaluation of existing river engineering and the practical need to select the best site for major projects, and also indicate the characteristics of Quaternary geomorphologic evolution. In order to analyze the incision rate and river reorganization trend in this basin, this study starts from the perspective of geomorphology and reveals the geomorphologic characteristics of this basin through the calculation and interpretation of quantitative geomorphologic indicators, including the steep index (Shi, 2019), morphological dating index (Demoulin, 2011, 2012), and Chi-plots (χ-z) (Willett et al., 2014; Sean, 2018). We determined the incision rate of the river based on a reconstruction of the equilibrium longitudinal profile of the main channel and a determination of the time of the last base-level decline. Thereafter, we discuss the migration trend of sub-basins by calculating the spatial distribution characteristics of the Chi-value distribution.
2 Study area
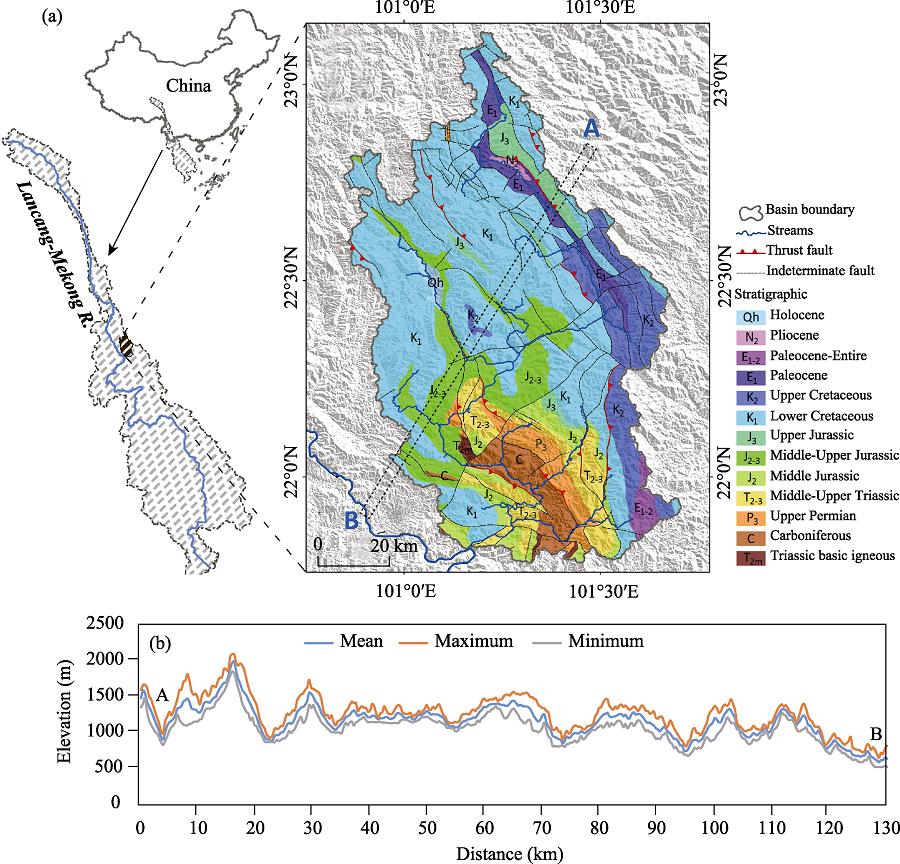
The Buyuan River is an important tributary of the upper Lancang-Mekong, the river basin covers an area of about 8931 km2 with an elevation range of 500-2290 m. The area was characterized by the interaction of coastal continental and transgression facies in the Early Paleozoic period. During the Late Paleozoic period, the basin area was a marine environment, mainly composed of limestone and dolomite strata, evolving into a terrestrial environment with strata and argillaceous sediments, during the early Mesozoic era (Ma, 2002). The majority of the faults in the basin are strike-slip faults, some of which are normal faults with a strike-slip rate of about 0.2-4 mm/yr, and the main fault activities commenced in the Pliocene epoch (Wu, 2016). Although the modern surface outcrop in the study area is a sedimentary layer formed in the Mesozoic period, the lithological characteristics mainly differ in age. A large area of Cretaceous strata is exposed in the north, and older strata are exposed in the south; later Paleozoic strata are exposed in the local area downstream (Figure 1). Currently, the basin is affected by a subtropical monsoon climate, with an annual average temperature of around 21.5℃ and annual average precipitation of 1488 mm, mainly concentrated between June and November. River discharge is recharged by precipitation, and the annual average value is about 178 m³/s, accounting for 1.2% of the total discharge of the Lancang-Mekong River (He, 1995).
Figure 1.
(a) A geological map of a scale 1:1 million of the Buyuan River basin in the upper Lancang-Mekong (<uri>http://www.ngac.org.cn</uri>) and (b) Swath profiles of the Digital Elevation Model (DEM)
The research is mainly based on Digital Elevation Models (DEMs) with a~30 m spatial resolution and a~5 m height error (Elkhrachy, 2018; Zhang et al., 2019) provided by the Shuttle Radar Topography Mission (SRTM) from the National Aeronautics and Space Administration (http://earthexplorer.usgs.gov).
3.2 Methods
3.2.1 Morphometric dating
The morphological dating method was proposed by Demoulin (2011, 2012). The response of erosion to a base-level decline begins in the main channel and is transmitted through the river network to the entire basin due to the traceable migration of knickpoints. The response time of the longitudinal profile of the mainstream, the river network and the whole basin to the decline of base-level corresponds to a short, medium and long-time scale, respectively. Therefore, the metric R* designed by Demoulin (2011, 2012) can be presented as follows:
where $\mathop{\int }^{}{{H}_{\text{r}}}$, $\mathop{\int }^{}{{H}_{\text{n}}}$ and $\mathop{\int }^{}{{H}_{\text{b}}}$ represent the hypsometric integral of the mainstream, the hypsometric integral of drainage network and the hypsometric integral of the basin, respectively (Demoulin, 2011; Demoulin et al., 2017; Shi, 2019). These can be calculated using the following formula:
Where$\bar{H},$ Hmin, and Hmax represent the mean, minimum, and maximum elevation of longitudinal profiles, the river network and the basin, respectively (Pike et al., 1971; Shi, 2019). Catchments of different sizes can be extracted along the main channel and the R* value of each catchment can be calculated by Eqs. (1) and (2) (Demoulin et al., 2017; Shi, 2019). As the influences of lithology and climate on a river network and the whole basin are similar (Demoulin, 2012), the ratio operation in Eq. (1) cancels out the influences to the greatest extent and R* is mainly affected by the irregularity of the basin plane morphology (Demoulin et al., 2017). However, R* is corrected by multiplying a factor of $1/\sqrt{E}$ to eliminate the effect of the river network on basin elongation and branching level. E is calculated as 4A/(πLb2), in which A (km²) is the catchment area and Lb (km) is the maximal length of a basin, measured from its outlet. An empirical relation established according to known dates of uplift episodes in many regions of the world is:
$t=0.009S_{\text{R}}^{-4},\ \ \ {{R}^{2}}=0.96,$
where t represents the starting time (Ma), SR is the slope of the linear fitting function of R* = SR (Ln A) + b in a region of homogeneous uplift (Demoulin, 2012). The morphological dating method requires that the area of a tectonic uplift block should not be less than 1000 km2 to ensure a stable relationship between R* and Ln A (Demoulin et al., 2017). The extraction of each index can be conducted on the ArcGIS 10.2 software platform, and the extraction threshold of the river network was set to 0.5 km2.
3.2.2 Reconstruction of a paleo-profile in a stable state
The local slope of the river channel in an eroded basin can be considered to be mainly controlled by the tectonic uplift rate and the catchment area under natural conditions. Therefore, the following relationship exists:
$S={{k}_{s}}{{A}^{-\theta }},$
where ks and θ are steepness index and concavity index respectively (Flint, 1974; Snyder et al., 2000). For regions with consistent bedrock-climatic characteristics and uplift rates, the θ value of the longitudinal profile in a steady state is generally between 0.4 and 0.6 and is determined by the downstream rates of increase in the discharge and channel width (Kirby et al., 2012). As the term “knickpoint” represents the position where the slope of the longitudinal profile changes abruptly, and the traceable movement of knickpoints is usually considered a response to erosion base-level decline (Whipple, 2001), we consider that the current position of a knickpoint is due to an incision wave associated with the base-level fall by comparing the current longitudinal profile with the reconstructed longitudinal paleo-profile and assume that the original paleo-profile was in an equilibrium state in our analysis (Pastor et al., 2015). Based on these reasonable assumptions, the steepness index and concavity index of upper reaches of the knickpoint (Flint, 1974), together with catchment areas along the mainstream and the downstream distance, x (Hack, 1957), the paleo-longitudinal profile can be reconstructed by the following equation (Whipple et al., 1999; Whipple, 2001; Pastor et al., 2015):
where z is the elevation at a distance x; L is the distance from the outlet of river to the drainage divide; xc is the distance from the divide to the point at which fluvial processes become dominant over gravitational erosion processes; ka and h are Hack’s coefficient exponent respectively, and the other parameters have the same meaning as they did above.
3.2.3 Drainage reorganization
Drainage networks are adjusted to changing tectonic activity and climatic conditions until a balance is achieved between the catchment areas rather than maintaining static topographic features (Sean et al., 2017). In a basin, rivers on both sides of the divide have the same erosion datum and elevation difference. In this case, a river reach with a larger Chi (χ) value usually has a lower ks value, and a low ks value usually implies a low erosion rate. If there are no significant differences in lithology on both sides of the divide, the divide will then move to the side with a low erosion rate (Willett et al., 2014). The χ can be calculated using the following equations:
where U, K, A and A0 are uplift rate, erosion rate, catchment area and a reference area respectively; z and zb are the elevation of a river profile at an observation point indicated by x, and the elevation of the profile at a base level indicated by xb, respectively. When A0 = 1 m², the slope of χ-z is ks (Perron et al., 2013). The Chi-plot calculation is finished by code based on Eq. (7) in the ArcGIS 10.2 software platform. According to the Strahler system, we divide the basin into several sub-basins and appropriately merge the broken areas with very small sizes to facilitate the exploration of river reorganization in the basin.
4 Results
4.1 Knickpoint and base-level decline
A drainage network is a dynamic system that adjusts to perturbations in the landscape, such as tectonic deformations and climate changes, to reach an equilibrium state between fluvial erosion and base level variations (Struth et al., 2019). Knickpoints represent a transient response to external perturbations. The longitudinal profile of the mainstream shows that there are two obvious knickpoints 42 km and 144 km away from the river source, reflecting the disturbance in the longitudinal profile caused by two large-scale base-level descending events (Figure 2a). Since knickpoint-I is located near the river source, we can conclude that the basin has almost completed the main response phase to the first decline in base level. Utilizing dating based on morphology methods related to estimating the latest decrease in data time points in conjunction with the empirical relationship of t-SR (Demoulin et al., 2017), we can date knickpoint-II to around 46 ka BP. (Figure 2b).
Figure 2.
(a) Features of the longitudinal profile of the Buyuan River; (b) Regional dependence of the <italic>R<sup>*</sup></italic>-metric on catchment size <italic>A</italic> (km<sup>2</sup>) of the Buyuan River basin. Note: The errors in (a) are due to the overfilling of the depression caused by the horizontal error.
The channel upstream of knickpoint-I has undergone a long period of erosion evolution and has been in a steady state. The steep index of the steady-state profile is extracted via Chi-plot (Figure 3a), and then the downstream steady-state profile was reconstructed according to Eq. (5), which could reflect the steady-state bed elevation distribution before the first phase of base-level decline (Figure 3b). Additionally, it also can find another reach close to the steady state in knickpoint-II that is located 60-131 km downstream of the river source. According to the extracted steady-state parameters, ks can also be used to reconstruct the downstream steady-state paleo-longitudinal profile (Figure 3b). At the estuarine location, the elevation differences between the two-stage steady-state longitudinal profiles and the modern riverbed are 299 m and 151 m.
Figure 3.
(a) Chi-plots of the local equilibrium reach; (b) Equilibrium longitudinal profiles with <italic>θ </italic>= 0.43 and the <italic>k</italic><sub>sn</sub> values of 24.75 and 17.25 shown in (a). The coefficient, <italic>θ</italic>, can be determined according to the optimal linear fitting coefficient (<italic>R</italic>²) of Chi-plot.
River capture is an inevitable phenomenon in the process of transient geomorphology adjustment, which will lead to changes in the spatial pattern of a drainage system in the basin. Depending on Chi-maps, the degree of disequilibrium of the drainage divides and the trend of horizontal motion needed to reach an equilibrium state can be visually reflected (Struth et al., 2019). We calculated the Chi-value distribution in the basin by taking the river outlet as xb so that the height differences between the two sides of the sub-basin and the river outlet are the same. In this way, the Chi-value can indirectly reflect the difference in ks. The results indicate that the two sides of the divide line have significant differences in Chi-distributions in the northern part of the basin, especially at the intersecting location of 3-4 sub-basins (Figure 4). If the influence of lithological differences on the headstream erosion rate is not taken into account, it can be assumed that the headstream erosion rates in different directions in these areas are unbalanced. Besides, Chi-values on both sides of the divide are roughly equal, and the divides without blue arrows in Figure 4a are basically in equilibrium.
Figure 4.
Chi-plot of the Buyuan River basin with <italic>A</italic><sub>0</sub> = 1 km<sup>2</sup> and <italic>θ </italic>= 0.43. The reference concavity value, <italic>θ</italic> = 0.43, is the average of the <italic>θ</italic>-values corresponding to the best linear fitting coefficients (<italic>R</italic><sup>2</sup>) of χ-z profiles of all major channels. Panel (a) shows the distribution of Chi-values and the trend of the river network reorganization in the basin; panel (b) shows two examples of a Chi-plot at the same height difference extracted from (a), and the linear slope represents a steepness difference; panel (c) reflects the longitudinal profiles of the main channel in the basin and the annual precipitation along the mainstream; panel (d) is a three-dimensional remote sensing image of (a).
The longitudinal profile gives more accurate results compared to the traditional field obser-vations and is the most sensitive geomorphic feature, which maintains evidence of terrain deformation and structural changes in geologic past (Das, 2018). A base level decline can drive a knickpoint migration traceability (Struth et al., 2019). According to the longitudinal profile characteristics, we infer that, after the first phase of base-level decline in the basin, another base-level decline event occurred in the downstream riverbed when the riverbed reached a steady-state during the receding process of knickpoint-II, around 46 ka BP. Since a comparison between the equilibrium longitudinal profile and the current longitudinal profile can reflect the base level decline (Shi, 2019), combining this comparison with the elevation difference between the reconstructed equilibrium longitudinal profile and the current longitudinal profile can allow us to estimate that the incision rate of Buyuan River since the Late Pleistocene is about 0-3.28 mm/yr, during which the position of the maximum incision rate occurred in the river outlet. Given the background of the landform evolution in the Lancang River basin, new dating results of OSL, (U-Th)/He (TL) and 10Be (CN) on river terrace sediments indicate that the Lancang River has experienced four aggradation events at > 120-100 ka, 90-70 ka, 25-15 ka, and < 9 ka, with each event followed by a rapid incision at 100 ka BP, 45 ka BP, 15 ka BP, and 6 ka BP (Zhang et al., 2018).
As a large tributary of the Lancang River, the Buyuan River is likely to be affected by these significant environmental changes at the corresponding stage. The estimated time of the most recent erosion base-level decline event (46 ka BP) in the Buyuan River basin is close to that of the second rapid cutting event (45 ka BP) of the Lancang River in the Late Pleistocene. Due to knickpoint-I being located upstream of knickpoint-I, it is more likely to be affected by an earlier erosion base-level decline. Therefore, there is a possibility that the rapid cutting event of Lancang River at 100 ka BP has a corresponding time relationship with knickpoint-II. It can be inferred that, during 100-46 ka BP, the incision rate of Buyuan River might have been 0-2.74 mm/yr according to the ratio of elevation difference to time, and the average incision rate during the Late Pleistocene would have been 0-2.99 mm/yr. These results are similar to the incision rate (0.5-2.8 mm/yr) in the Lancang reaches upstream from the intersection of Buyuan River and Lancang River (Figure 5) (Zhang et al., 2018). Note that the two rapid cutting events of Lancang River in 15 ka BP and 6 ka BP mentioned by Zhang et al. (2018) were not interpreted from morphological dating and the longitudinal profile in this analysis. This may be because these two cutting events are localized, but it is more likely that the geomorphologic characteristics of the Buyuan River basin have not yet demonstrated obvious responses to morphological change in the short time since the events, because the time scale of the response of the geomorphologic evolution of the basin to tectonic activity and climate change is generally between 104 and 106 years (Demoulin et al., 2017); this may also be due to the vertical accuracy limitations of the DEM.
Figure 5.
Longitudinal profile of the Lancang-Mekong River and its corresponding stream power. The information on the incision rate comes from <xref ref-type="bibr" rid="b38">Zhang <italic>et al</italic>. (2018)</xref>. Stream power, Ω = <italic>γQs</italic>, where <italic>γ</italic> = 9800 (N/m³), <italic>Q</italic> = discharge (m³/s), and <italic>s </italic>= riverbed slope (<xref ref-type="bibr" rid="b18">Pérez-Peña<italic> et al</italic>., 2010</xref>; <xref ref-type="bibr" rid="b1">Das, 2018</xref>; <xref ref-type="bibr" rid="b8">Gu<italic> et al.</italic>, 2018</xref>).
Surface processes in the unstable state are complex, but they retain the topographic characteristics before and after the change in boundary conditions and contain information to explain the past and future geomorphic evolution trend (Whipple, 2001; Struth et al., 2019). We use Chi-plots to explore the different degrees of erosion in the Buyuan River basin and the drainage reorganization. Observing the Chi-plots, differences across the divides suggest that the spatial range of the disequilibrium region is relatively limited. In many areas, similar Chi-values at the source of river on opposite sides of a divide indicate that the drainage network is close to a geometric equilibrium state. Along the divide line of the sub-basins, the uneven parts of the Chi-value mainly appear in the intersecting area of the river sources of 3-4 sub-basins, while the lithology differences in these areas are not large (Figures 1 and 4a). Therefore, we believe that there is no severe recombination of water systems in the basin and that the imbalance of traceable erosion only exists in local areas. These analysis results show that river reorganization is not a universal phenomenon in the current geomorphic evolution in the orogenic belt areas around the Qinghai-Tibet Plateau. Geomorphologic evolution dynamics at the basin scale are derived from tectonic uplift and climate change (Whipple et al., 1999; Demoulin et al., 2017); however, recent studies have shown that there is a relatively obvious decoupling phenomenon in the formation and development of the Lancang River basin. The hydrologic driven incision of a large fluvial system in southeast Tibet is mostly likely related to local climate conditions rather than tectonically driven erosion, especially at a time scale of 10-100 ka (Nie et al., 2018; Zhang et al., 2018). Besides, the intensity of neotectonic activity in the basin is relatively weak, according to an evaluation of the tectonic geomorphology index (Gu et al., 2019), which indicates that the basin is less likely to have significant tectonic uplift in the Late Pleistocene. It seems that, since the Late Pleistocene, the change in the geomorphic evolution characteristics in the Buyuan River basin, including river cutting, base-level decline, and river reorganization, is more likely driven by precipitation.
6 Conclusions
This study presents an analysis of incision and drainage reorganization of the Buyuan River basin in the upper Lancang-Mekong River of China. The application of morphological dating, paleo-profile reconstruction, and Chi-plots has helped us to demonstrate contrasts in the equilibrium state of rivers across divides and then to infer their migration. The results show that: (1) the mainstream of the Buyuan River was affected by at least two large-scale base-level decline events and retained two large knickpoints in the Late Pleistocene. (2) The earlier stage might have occurred in 100 ka BP, and the later stage likely occurred around 46 ka BP. (3) In comparison of the equilibrium profile of the two main channels with the modern river profile, it can be inferred that the average incision rate of the mainstream since the Late Pleistocene is 0-2.99 mm/yr since 100 ka BP and 0-3.28 mm/yr since 46 ka BP. (4) Besides, characteristics in the Chi-values across the divides suggest that the spatial range of the disequilibrium region is relatively limited and that there is no severe reorganization of the river network in the basin, and the imbalance of traceable erosion in the river network exists in local areas. (5) Since the Late Pleistocene, the main driving force of the geomorphological evolution in the Buyuan River basin is likely climate fluctuations.
[6] Stream gradient as a function of order, magnitude, and discharge. Water Resources Research, 10, 969-973(1974).
[7] Quantitative analysis of the macro-geomorphic evolution of Buyuan Basin, China. Journal of Mountain Science, 16, 1035-1047(2019).
[8] Dynamical characteristics of geomorphologic evolution of the basins covered by Pisha-sandstone in the eastern wing of the Ordos Plateau, China. Journal of Mountain Science, 15, 1046-1056(2018).
[12] et alRapid fluvial incision and headward erosion by the Yellow River along the Jinshaan gorge during the past 1.2 Ma as a result of tectonic extension. Quaternary Science Reviews, 133, 1-14(2016).
[13] Expression of active tectonics in erosional landscapes. Journal of Structural Geology, 44, 54-75(2012).
[16] et alRapid incision of the Mekong River in the middle Miocene linked to monsoonal precipitation. Nature Geoscience, 11, 944-948(2018).
[17] et alExtracting dynamic topography from river profiles and cosmogenic nuclide geochronology in the Middle Atlas and the High Plateaus of Morocco. Tectonophysics, 663, 95-109(2015).
[18] et alSpatial analysis of stream power using GIS: SLK anomaly maps. Earth Surface Processes & Landforms, 34, 16-25(2010).
[19] An integral approach to bedrock river profile analysis. Earth Surface Processes & Landforms, 38, 570-576(2013).
[24] Lithologic controls on landscape dynamics and aquatic species evolution in post-orogenic mountains. Earth and Planetary Science Letters, 493, 150-160(2018).
[25] River profile response to normal fault growth and linkage: An example from the Hellenic forearc of south-central Crete, Greece. Earth Surface Dynamics, 5, 161-186(2017).
[26] Ages and magnitudes of base level fall and valley downcutting in ten tributaries (the Ten Kongduis) of the upper Yellow River, China. Geomorphology, 325, 29-39(2019).
[27] Late Quaternary evolution of Tista River terraces in Darjeeling-Sikkim-Tibet wedge: Implications to climate and tectonics. Quaternary International, 443, 132-142(2017).
[28] et alLandscape response to tectonic forcing: Digital elevation model analysis of stream profiles in the Mendocino triple junction region, northern California. Geological Society of America Bulletin, 112, 1250-1263(2000).
[30] Late Miocene birth of the Middle Jinsha River revealed by the fluvial incision rate. Global and Planetary Change, 183, 103002(2019).
[31] et alLatest Pleistocene to Holocene loess in the central Great Plains: Optically stimulated luminescence dating and multi-proxy analysis of the Enders loess section (Nebraska, USA). Quaternary Science Reviews, 229, 106130(2020).
[39] et alAccuracy assessment of ASTER, SRTM, ALOS, and TDX DEMs for hispaniola and implications for mapping vulnerability to coastal flooding. Remote Sensing of Environment, 225, 290-306(2019).
Zhenkui GU, Hui FAN, Kun YANG. GIS and DEM based analysis of incision and drainage reorganization of the Buyuan River basin in the upper Lancang-Mekong of China since the Late Pleistocene[J]. Journal of Geographical Sciences, 2020, 30(9): 1495