
Lin Wang, Qiang Liu. A Multi-Object Image Segmentation Algorithm Based on Local Features[J]. Laser & Optoelectronics Progress, 2018, 55(6): 061002
- Laser & Optoelectronics Progress
- Vol. 55, Issue 6, 061002 (2018)
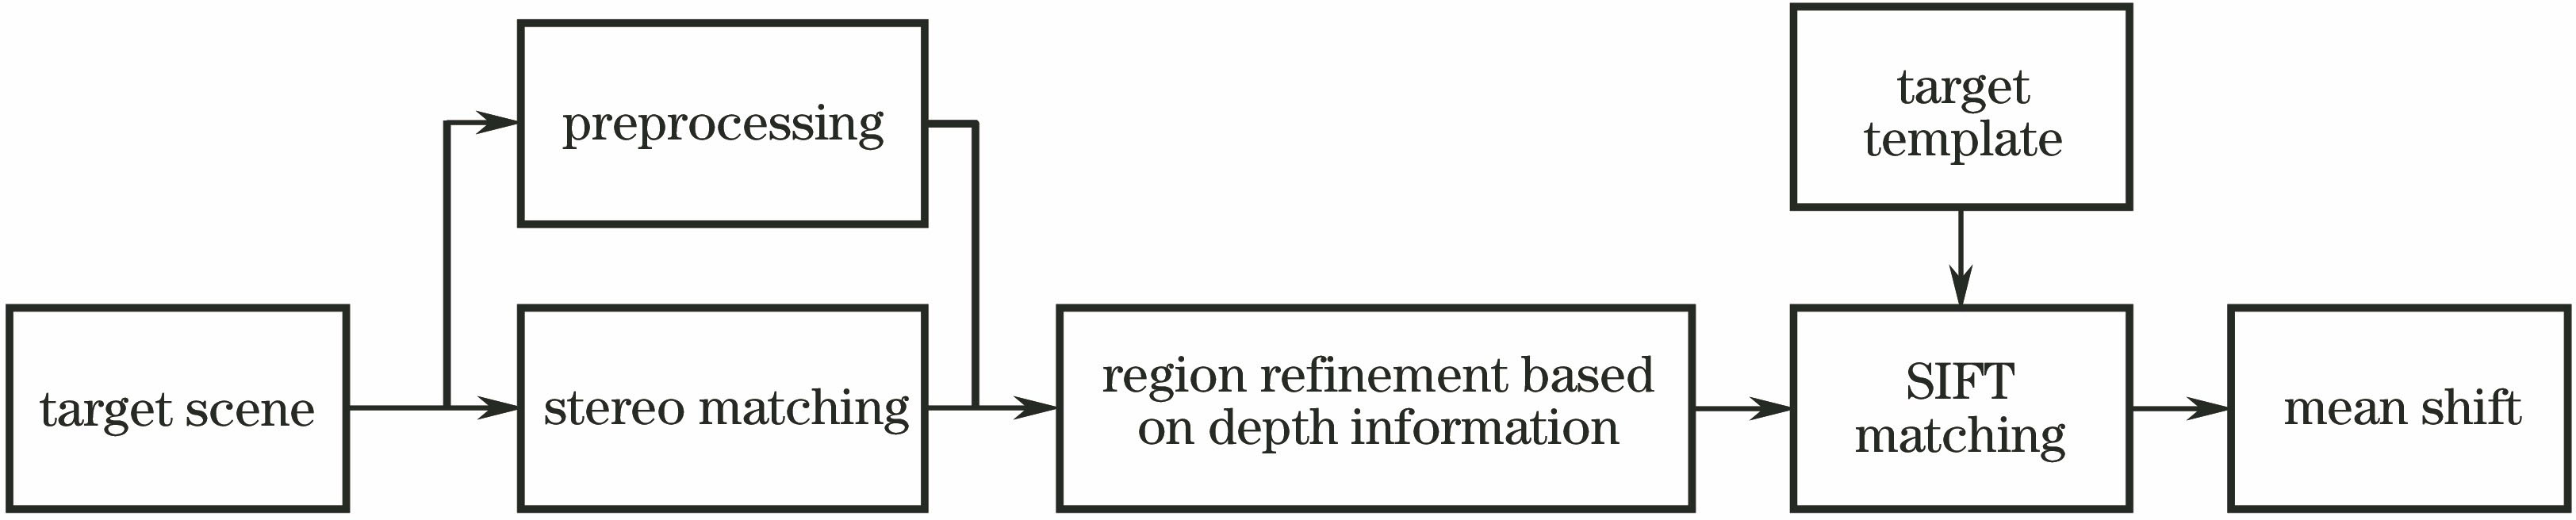
Fig. 1. Flow chart of the proposed algorithm
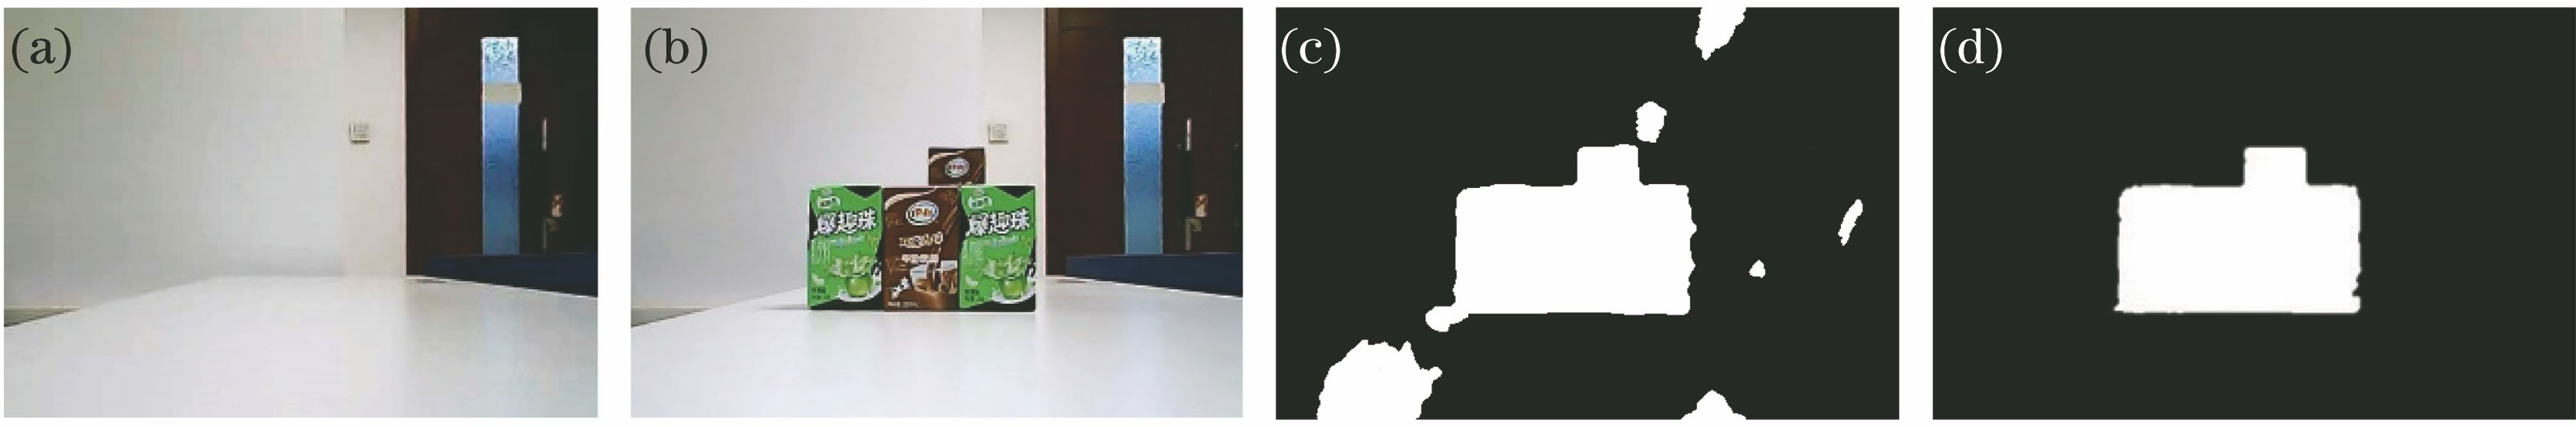
Fig. 2. (a) Background image; (b) scene image; (c) result with fixed threshold; (d) result with adaptive threshold
Fig. 3. Eight experimental scenarios
Fig. 4. Segmentation results obtained by different algorithms for the scene No. 5. (a) Algorithm in Ref. [5]; (b) FCN algorithm; (c) proposed algorithm with preprocessing; (d) proposed algorithm without preprocessing
Fig. 5. Segmentation results obtained by different algorithms for the scene No. 8. (a) Algorithm in Ref. [5]; (b) FCN algorithm; (c) proposed algorithm with preprocessing; (d) proposed algorithm without preprocessing
| ||||||||||||||||||||||||||||
Table 1. Comparison of matching points between adaptive threshold and fixed threshold
| ||||||||||||||||||||||||||||||||
Table 2. Comparison of mismatching rate between the proposed SIFT algorithm and the original SIFT algorithm
| |||||||||||||||||||||||||||||||||||||||||||||||||||||||||||||||||||||||||||||||||||||||||||||||||||||||||||||||||||||||||||||||||||||||
Table 3. Comparison of segmentation errors among FCN algorithm, the algorithm in Ref. [5] and the proposed algorithms
|
Table 4. Runtime of each stage of the proposed algorithm (unit: s)

Set citation alerts for the article
Please enter your email address
© Copyright 2018-2021 | Chinese Laser Press. All Rights Reserved 沪ICP备15018463号-20