• Acta Optica Sinica
  • Vol. 40, Issue 8, 0830001 (2020)
Tianyou Hu, Zhili Chen*, Jin Tang, Haowen Wang, and Jialian Ning
Author Affiliations
  • College of Environmental Science and Engineering, Guilin University of Technology, Guilin, Guangxi 541006, China
  • show less
    DOI: 10.3788/AOS202040.0830001 Cite this Article Set citation alerts
    Tianyou Hu, Zhili Chen, Jin Tang, Haowen Wang, Jialian Ning. Model Construction for Soil Styrene Pollution Prediction Based on Infrared Spectroscopy[J]. Acta Optica Sinica, 2020, 40(8): 0830001 Copy Citation Text show less
    Spectral curves of different styrene contaminated soils. (a) Brick laterite; (b) black soil; (c) purple soil; (d) uncontaminated soil
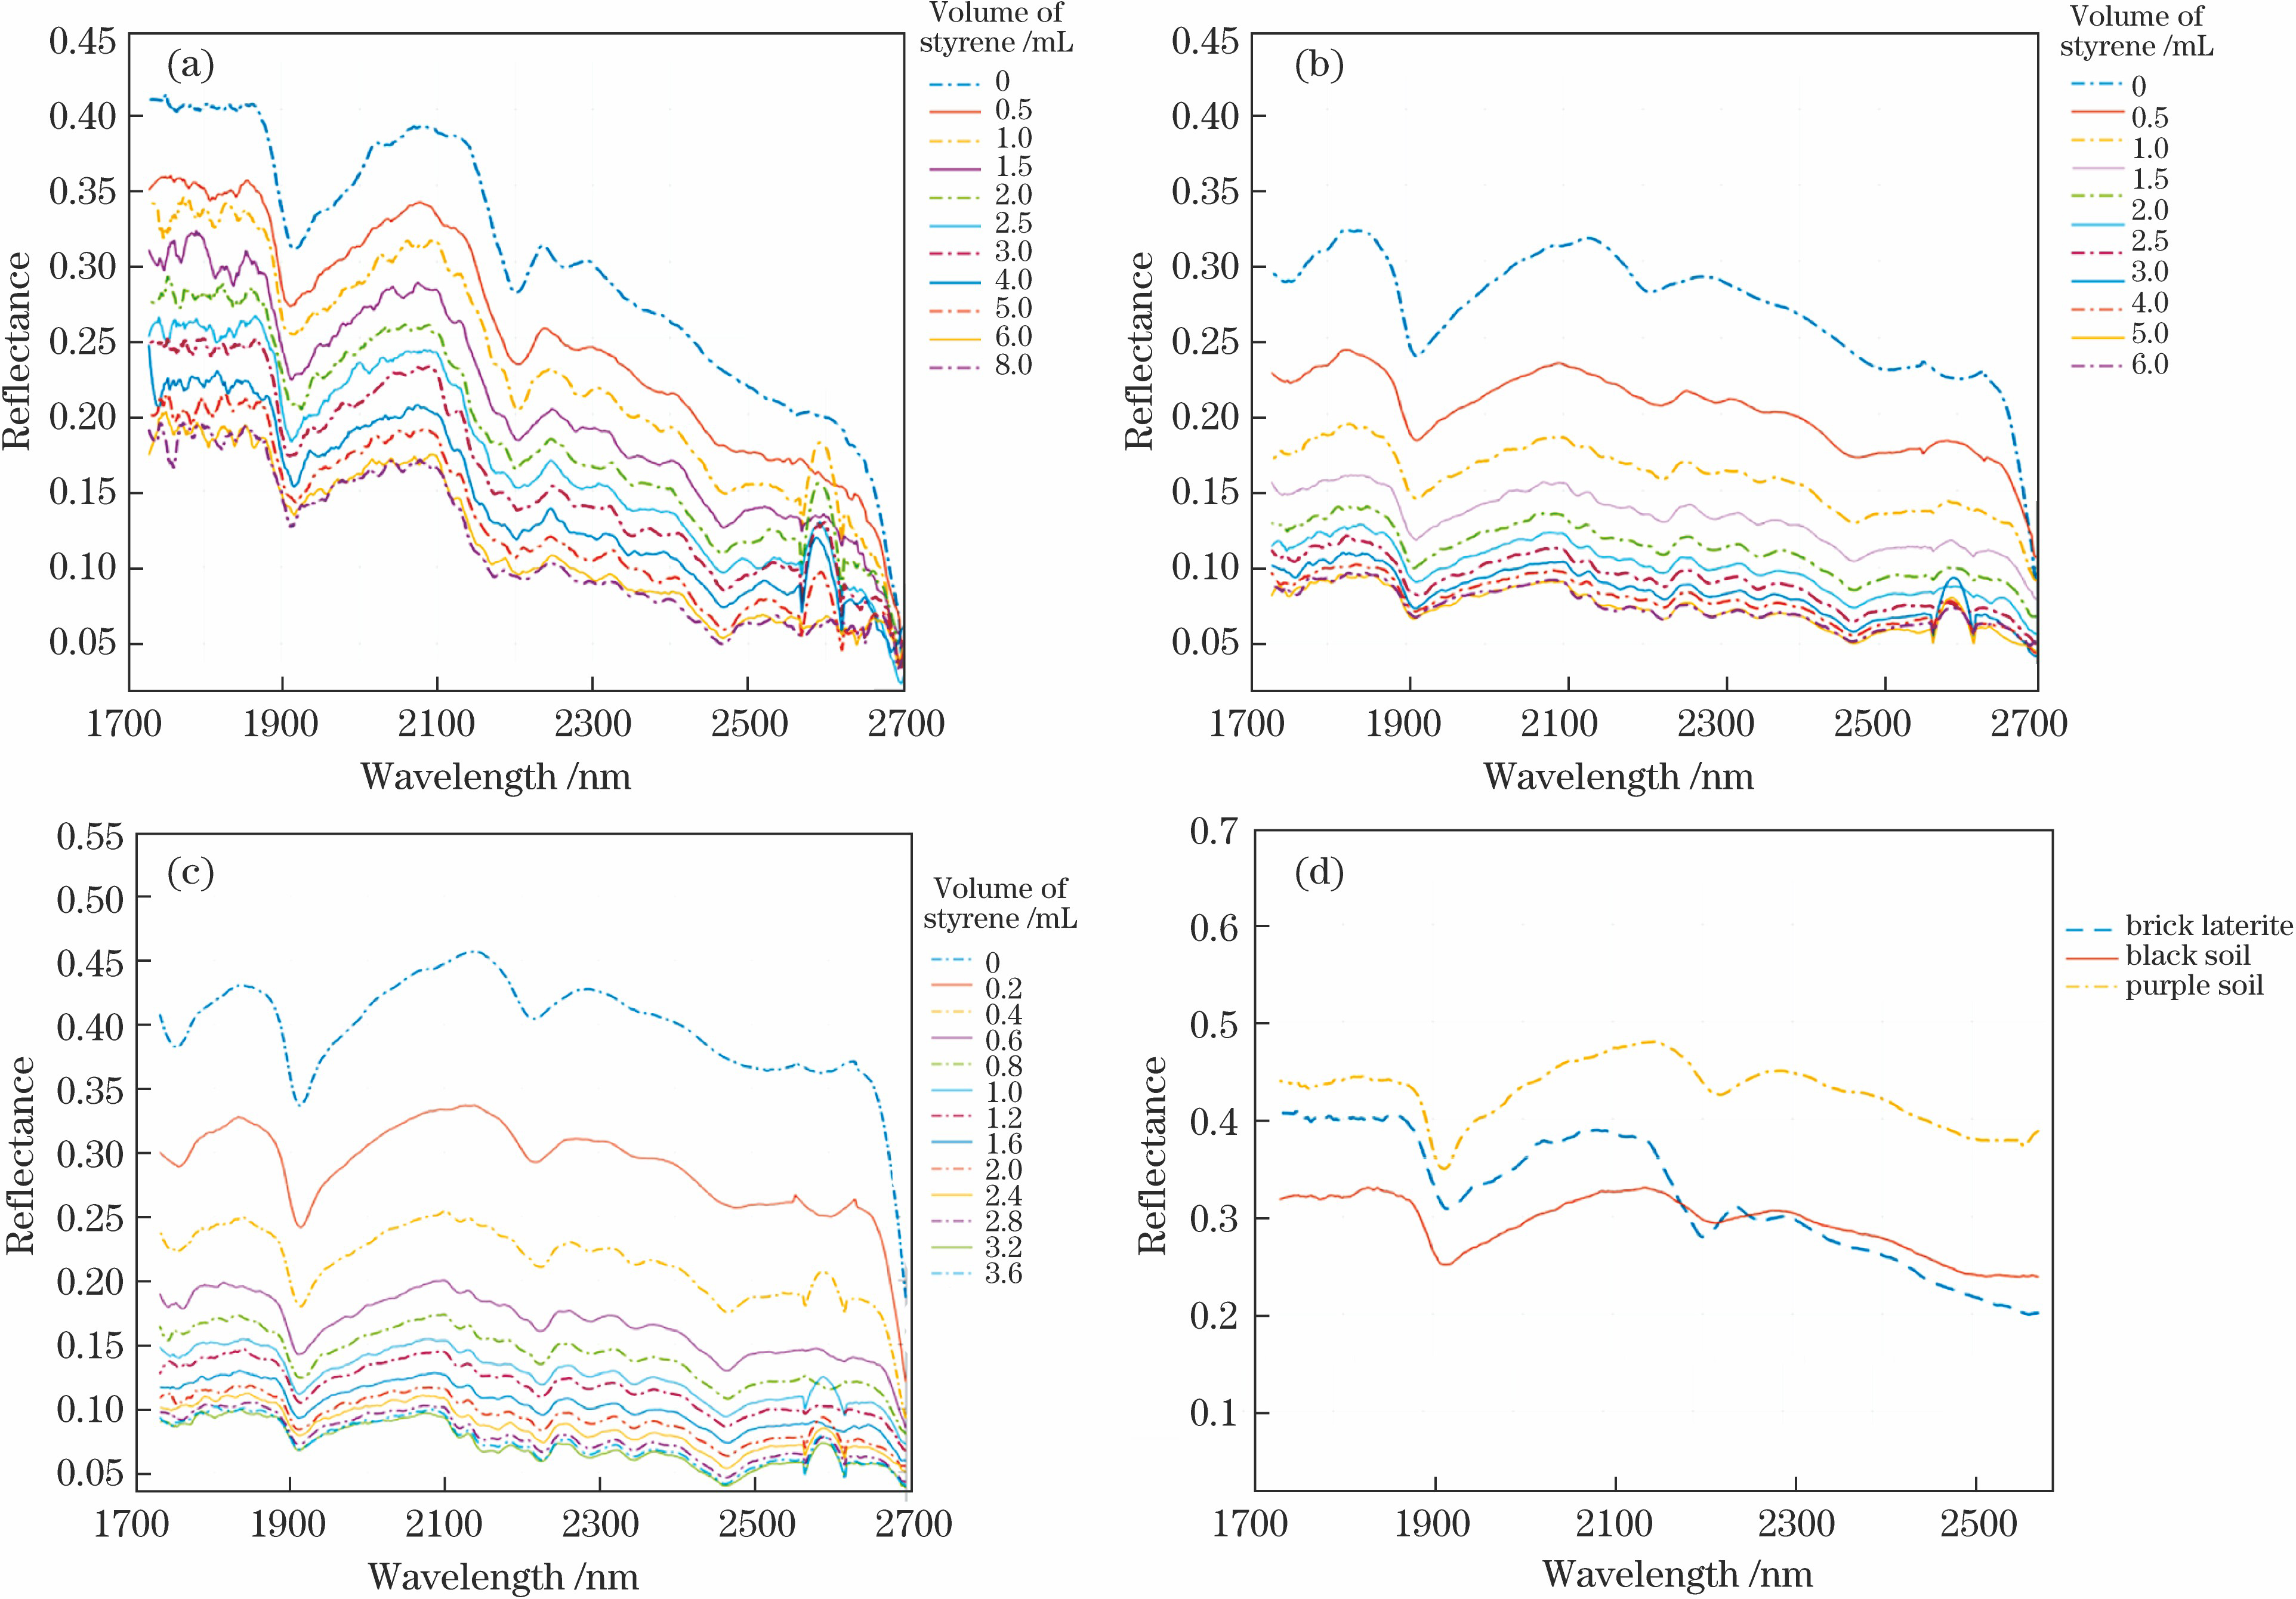
    Fig. 1. Spectral curves of different styrene contaminated soils. (a) Brick laterite; (b) black soil; (c) purple soil; (d) uncontaminated soil
    Spectral curves of different styrene contaminated soils after continuum removal processing. (a1)(b1)(c1) Feature band is located at 1800 nm; (a2)(b2)(c2) feature band is located at 2200 nm and 2400 nm
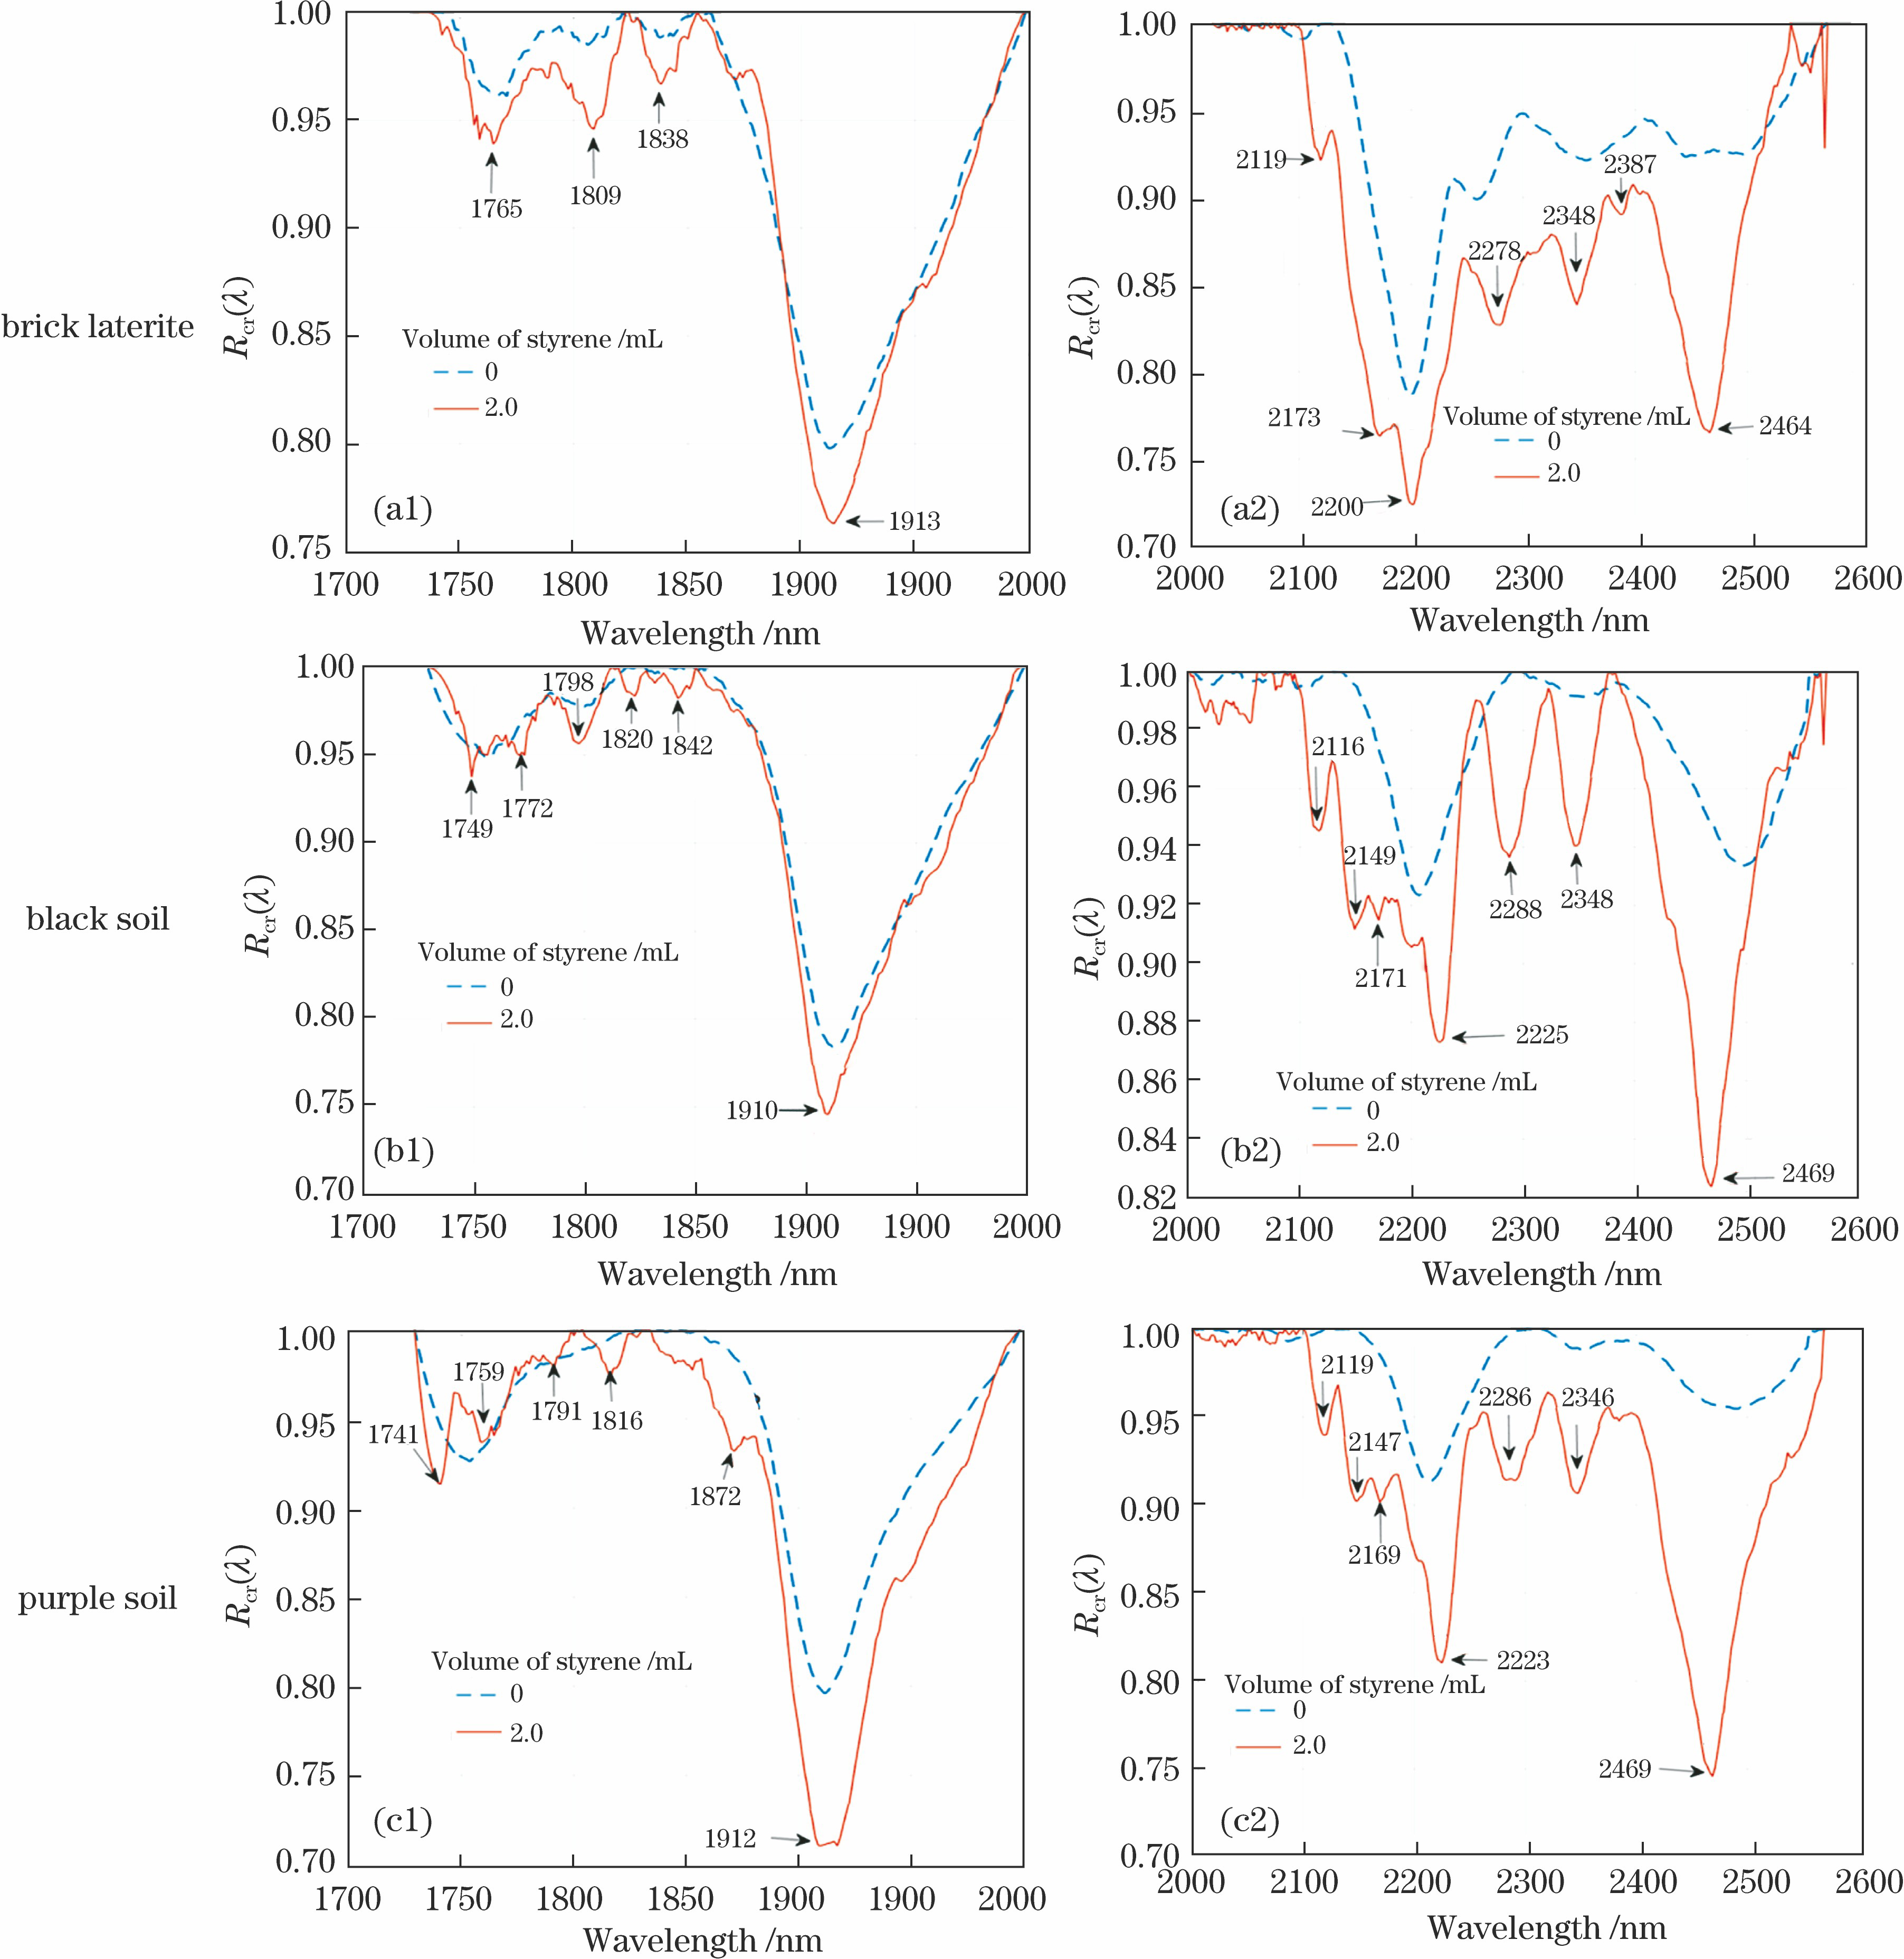
    Fig. 2. Spectral curves of different styrene contaminated soils after continuum removal processing. (a1)(b1)(c1) Feature band is located at 1800 nm; (a2)(b2)(c2) feature band is located at 2200 nm and 2400 nm
    Styrene contents in three soils predicted by different models. (a) Styrene-brick laterite; (b) styrene-black soil; (c) styrene-purple soil
    Fig. 3. Styrene contents in three soils predicted by different models. (a) Styrene-brick laterite; (b) styrene-black soil; (c) styrene-purple soil
    Soil typeSampled areapHOrganic matter content/(g·kg-1)Soil textureVolume fraction /%
    ClaySiltSand
    Brick lateriteHaikou, Hainan6.06.18Sandy loam17.6525.4356.92
    Black soilHulunbeir, Inner Mongolia7.246.55Clay loam20.3638.1941.45
    Purple soilBeibei, Chongqing7.912.92Loamy clay33.4143.9122.68
    Table 1. Physical and chemical properties of tested soils
    Soil typeNumber of samplesInitial addition volume /mLVariable node /mLSubsequent addition volume /mLSaturation value /mL
    Brick laterite200.54.01.06.0
    Black soil200.55.01.05.0
    Purple soil200.22.40.43.6
    Table 2. Sample number and saturation content of soil and hydrocarbons
    Characteristicband /nmR1/Rln(1/R)1/ln(R)R'(1/R)'ln(1/R)'(1/ln R)'
    1766-0.95570.99600.98160.94140.06070.6514-0.21030.3356
    1809-0.95550.99670.98230.93670.6241-0.4953-0.6673-0.5506
    1884-0.95980.99550.98250.9459-0.6861-0.74870.7847-0.1121
    1913-0.94620.99660.97930.93530.1873-0.6094-0.1122-0.4585
    2119-0.93630.99610.97580.91600.24280.7118-0.43640.3616
    2173-0.93450.99780.97910.9239-0.91210.75360.87340.9760
    2200-0.93930.99920.98150.9332-0.59700.15360.61460.4241
    2278-0.93170.99870.97850.92320.6191-0.8906-0.6205-0.8189
    2348-0.93330.99880.97990.9290-0.3957-0.67410.4209-0.3047
    2387-0.94020.99930.98330.9369-0.4601-0.21150.47630.0882
    2464-0.90910.99860.97380.9141-0.2321-0.71700.1297-0.5027
    Table 3. Correlation coefficients of styrene in each characteristic band under different transformation forms of spectral reflectance of brick laterite
    Soil typeModel typeModel buildingModel prediction
    R12RMSECR12RMSEP
    Brick lateriteSMLR0.99860.109060.99660.11188
    PLSR0.99770.088710.99860.07520
    SVMR0.98440.23338
    Black soilSMLR0.99790.108420.99460.11257
    PLSR0.98230.202470.97930.21859
    SVMR0.96440.28913
    Purple soilSMLR0.99860.053470.99570.08226
    PLSR0.99210.089280.99280.08583
    SVMR0.98600.12311
    Table 4. Accuracy comparison and prediction verification among different models
    Tianyou Hu, Zhili Chen, Jin Tang, Haowen Wang, Jialian Ning. Model Construction for Soil Styrene Pollution Prediction Based on Infrared Spectroscopy[J]. Acta Optica Sinica, 2020, 40(8): 0830001
    Download Citation