• High Power Laser Science and Engineering
  • Vol. 10, Issue 4, 04000e25 (2022)
Akira Kon1、*, Mamiko Nishiuchi1, Yuji Fukuda1, Kotaro Kondo1, Koichi Ogura1, Akito Sagisaka1, Yasuhiro Miyasaka1, Nicholas P. Dover1, Masaki Kando1, Alexander S. Pirozhkov1, Izuru Daito1, Liu Chang1, Il Woo Choi2、3, Chang Hee Nam2、4, Tim Ziegler5、6, Hans-Peter Schlenvoigt5, Karl Zeil5, Ulrich Schramm5、6, and Hiromitsu Kiriyama1
Author Affiliations
  • 1Kansai Photon Science Institute, National Institutes for Quantum Science and Technology, Kyoto619-0215, Japan
  • 2Center for Relativistic Laser Science, Institute for Basic Science, Gwangju61005, Republic of Korea
  • 3Advanced Photonics Research Institute, Gwangju Institute of Science and Technology, Gwangju61005, Republic of Korea
  • 4Department of Physics and Photon Science, Gwangju Institute of Science and Technology, Gwangju61005, Republic of Korea
  • 5Helmholtz-Zentrum Dresden – Rossendorf, 01328Dresden, Germany
  • 6Technische Universität Dresden, 01062Dresden, Germany
  • show less
    DOI: 10.1017/hpl.2022.15 Cite this Article Set citation alerts
    Akira Kon, Mamiko Nishiuchi, Yuji Fukuda, Kotaro Kondo, Koichi Ogura, Akito Sagisaka, Yasuhiro Miyasaka, Nicholas P. Dover, Masaki Kando, Alexander S. Pirozhkov, Izuru Daito, Liu Chang, Il Woo Choi, Chang Hee Nam, Tim Ziegler, Hans-Peter Schlenvoigt, Karl Zeil, Ulrich Schramm, Hiromitsu Kiriyama. Characterization of the plasma mirror system at the J-KAREN-P facility[J]. High Power Laser Science and Engineering, 2022, 10(4): 04000e25 Copy Citation Text show less
    Layout and picture of the plasma mirror system at J-KAREN-P. (a) Layout of the PM setup. OAP, off-axis parabolic mirrors; PS, periscope; NF, near-field image camera; FF, far-field image camera; FPM, focus monitor on the PM; IS, integrating sphere and spectrometer; TOCC, third-order cross-correlator; SRSI, self-referenced spectral interferometry; FM, focus monitor. (b) PM chamber. (c) Periscope pair. (d) OAP and stage. (e) Substrate of single PM and damage pattern.
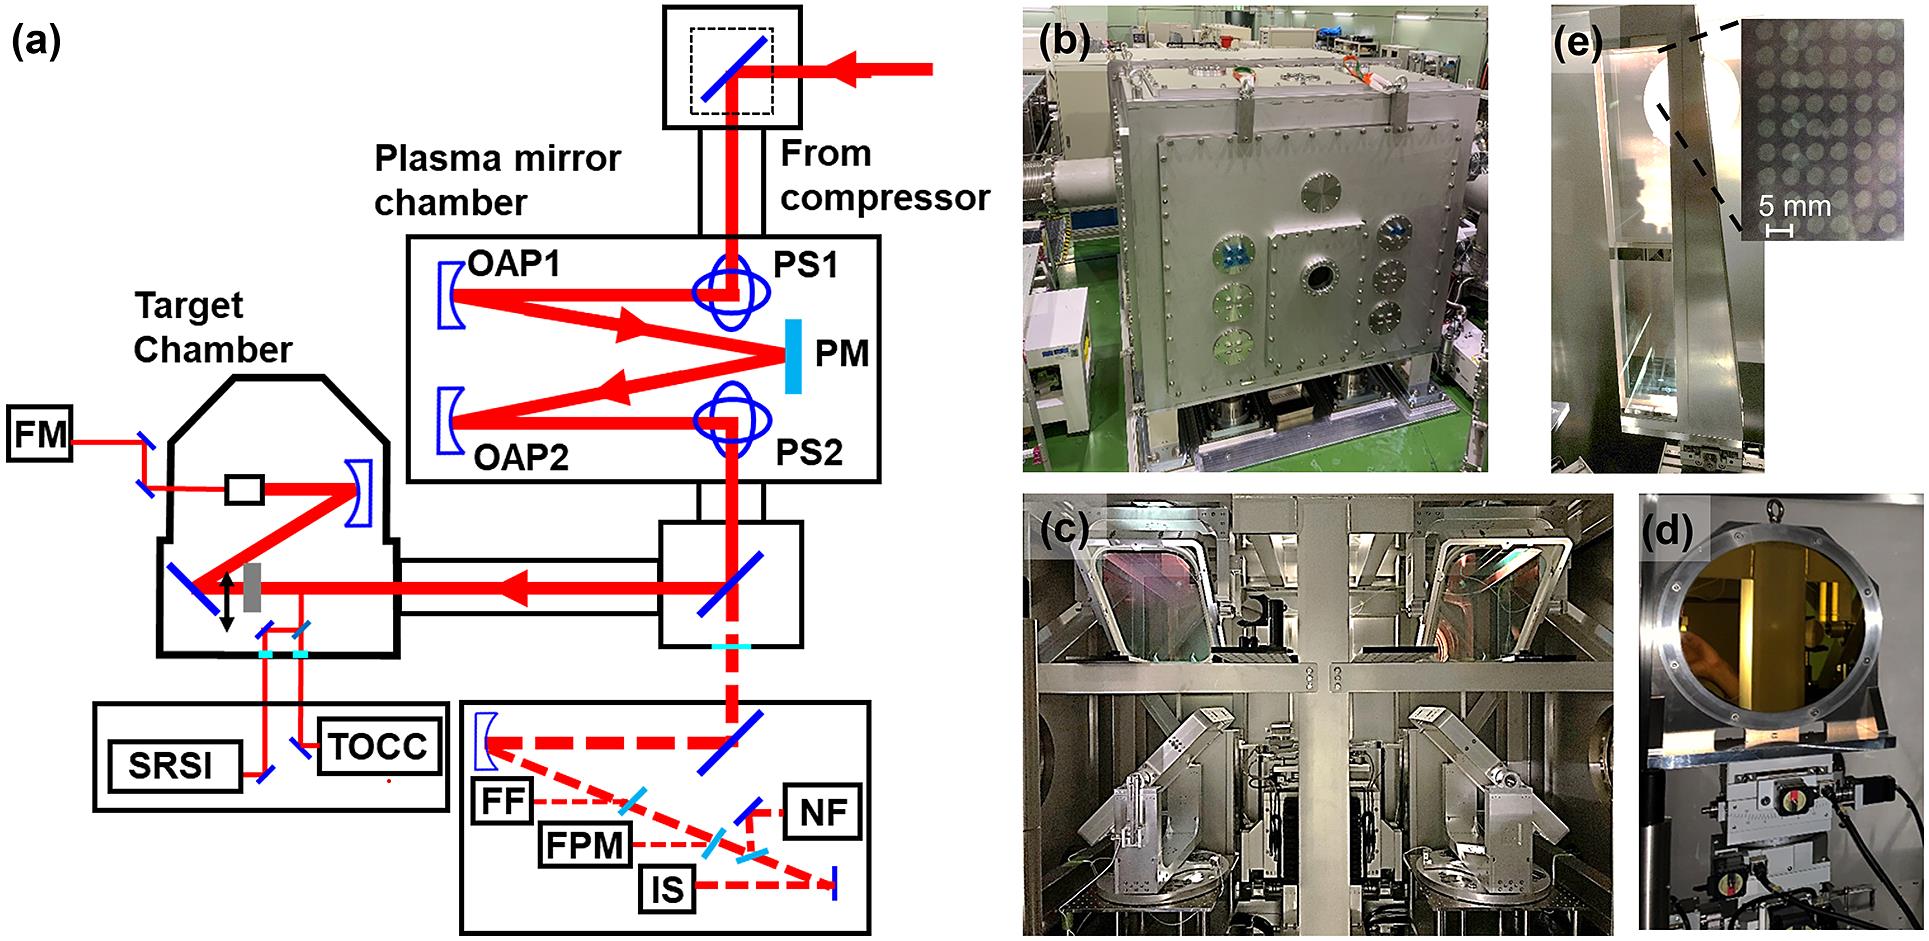
    Fig. 1. Layout and picture of the plasma mirror system at J-KAREN-P. (a) Layout of the PM setup. OAP, off-axis parabolic mirrors; PS, periscope; NF, near-field image camera; FF, far-field image camera; FPM, focus monitor on the PM; IS, integrating sphere and spectrometer; TOCC, third-order cross-correlator; SRSI, self-referenced spectral interferometry; FM, focus monitor. (b) PM chamber. (c) Periscope pair. (d) OAP and stage. (e) Substrate of single PM and damage pattern.
    Reflectivity of the plasma mirror system. The vertical axis shows the reflectivity estimated from the energy acquired before and after the PM system. The horizontal axis shows the fluence and the intensity of the PM, whose value was estimated by measuring the spot size on the PM. The inset image shows spots on the PM (500 J/cm2) obtained with the focus monitor on the PM (FPM; Figure 1(a)).
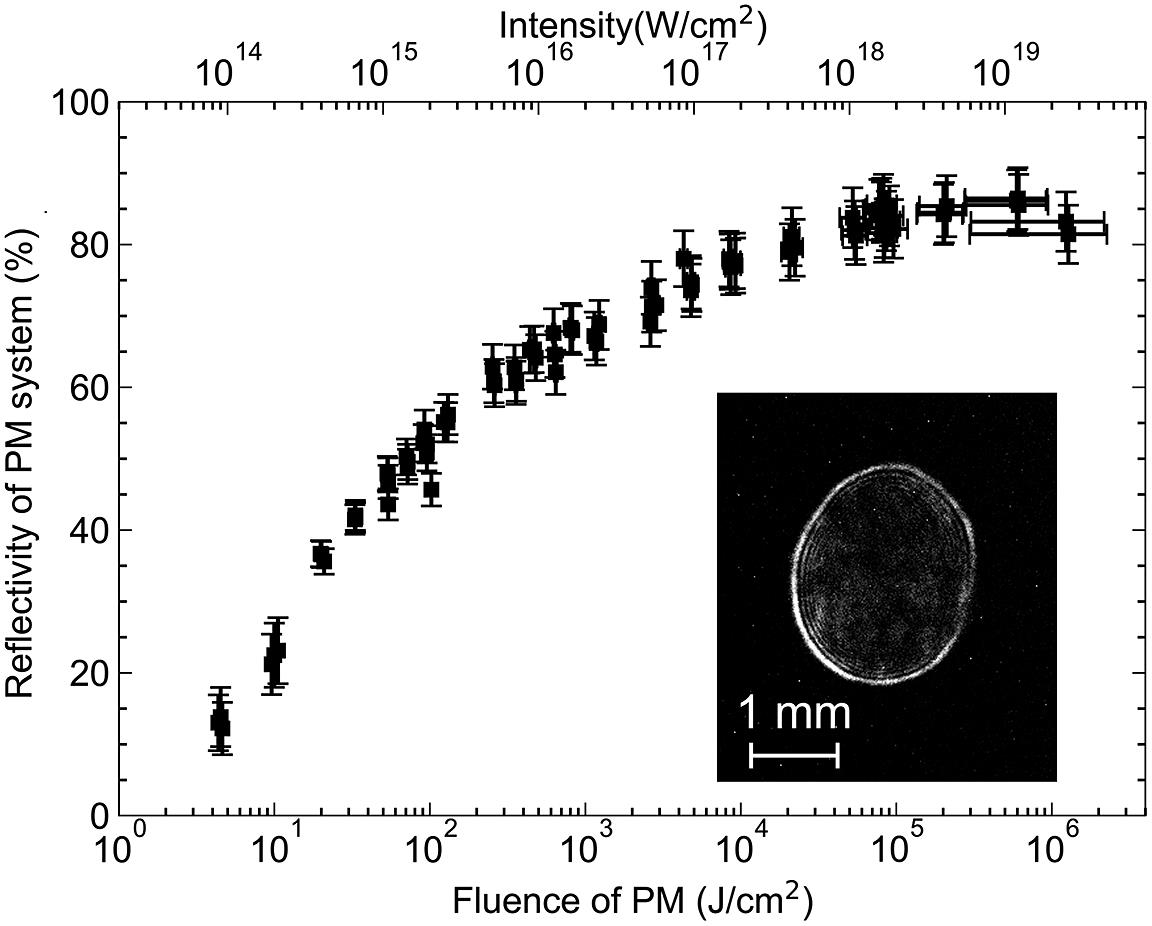
    Fig. 2. Reflectivity of the plasma mirror system. The vertical axis shows the reflectivity estimated from the energy acquired before and after the PM system. The horizontal axis shows the fluence and the intensity of the PM, whose value was estimated by measuring the spot size on the PM. The inset image shows spots on the PM (500 J/cm2) obtained with the focus monitor on the PM (FPM; Figure 1(a)).
    (a) Shot-to-shot energy variation during 40 shots without (9.0 ± 0.31 J) and with (5.9 ± 0.26 J) the PM. (b) Shot-to-shot energy variation during 10 shots at each fluence (0.1, 0.5, 2.5, 7.5 and 50 kJ/cm2), without the PM and before the PM for the same shots. The circles and triangles represent energy after the PM. Energy before the PM is shown with diamonds.
    Fig. 3. (a) Shot-to-shot energy variation during 40 shots without (9.0 ± 0.31 J) and with (5.9 ± 0.26 J) the PM. (b) Shot-to-shot energy variation during 10 shots at each fluence (0.1, 0.5, 2.5, 7.5 and 50 kJ/cm2), without the PM and before the PM for the same shots. The circles and triangles represent energy after the PM. Energy before the PM is shown with diamonds.
    Temporal contrast with (red line) and without (blue line) the PM. The dotted line is the temporal contrast estimated using the reflectance of the PM (65%) and AR coating (0.8%). The inset figure is an enlarged plot showing detail around the peak of the pulse. From the data points with and without the PM, the trigger time range for the PM is from –0.9 to –0.3 ps.
    Fig. 4. Temporal contrast with (red line) and without (blue line) the PM. The dotted line is the temporal contrast estimated using the reflectance of the PM (65%) and AR coating (0.8%). The inset figure is an enlarged plot showing detail around the peak of the pulse. From the data points with and without the PM, the trigger time range for the PM is from –0.9 to –0.3 ps.
    One hundred shots average of pulse duration measurement from the self-referenced spectral interferometer: (a) linear scale; (b) log scale. The error bars correspond to statistical variations. The arrow in (b) shows the pre-pulse generated when using the PM.
    Fig. 5. One hundred shots average of pulse duration measurement from the self-referenced spectral interferometer: (a) linear scale; (b) log scale. The error bars correspond to statistical variations. The arrow in (b) shows the pre-pulse generated when using the PM.
    Shot-to-shot fluctuation of pulse duration (FWHM): without the PM, 47 ± 1.4 fs; with the PM irradiated with a fluence of 500 J/cm2, 45 ± 1.0 fs.
    Fig. 6. Shot-to-shot fluctuation of pulse duration (FWHM): without the PM, 47 ± 1.4 fs; with the PM irradiated with a fluence of 500 J/cm2, 45 ± 1.0 fs.
    The spectrum of 10 shots average with and without the PM. The fluence of PM irradiation is 500 J/cm2. The error bars correspond to standard deviations of statistical variations.
    Fig. 7. The spectrum of 10 shots average with and without the PM. The fluence of PM irradiation is 500 J/cm2. The error bars correspond to standard deviations of statistical variations.
    Spatial profiles: (a) NF image; (b) FF image. The laser fluence on the PM is written above.
    Fig. 8. Spatial profiles: (a) NF image; (b) FF image. The laser fluence on the PM is written above.
    Focus spot images from the alignment laser (F/1.3), (a) without (X: 1.57 μm, Y: 1.65 μm) and (b) with the PM system (X: 1.66 μm, Y: 1.59 μm), with FWHM values given. The focused intensity is calculated as 100 TW of the integrated value of all signals. Note that (b) is the focused spot from a highly reflective coated part of the PM substrate, rather than an activated PM.
    Fig. 9. Focus spot images from the alignment laser (<μJ) after focusing by the OAP (F/1.3), (a) without (X: 1.57 μm, Y: 1.65 μm) and (b) with the PM system (X: 1.66 μm, Y: 1.59 μm), with FWHM values given. The focused intensity is calculated as 100 TW of the integrated value of all signals. Note that (b) is the focused spot from a highly reflective coated part of the PM substrate, rather than an activated PM.
    Pointing stability of the alignment laser (F/1.3) at the target position: (a) horizontal axis; (b) vertical axis. The standard deviations are X: 1.11 μrad, Y: 1.22 μrad with the PM and X: 1.99 μrad, Y: 2.07 μrad without the PM. Note that the PM dataset is from a highly reflective coated part of the PM substrate, rather than an activated PM.
    Fig. 10. Pointing stability of the alignment laser (<μJ) with the OAP (F/1.3) at the target position: (a) horizontal axis; (b) vertical axis. The standard deviations are X: 1.11 μrad, Y: 1.22 μrad with the PM and X: 1.99 μrad, Y: 2.07 μrad without the PM. Note that the PM dataset is from a highly reflective coated part of the PM substrate, rather than an activated PM.
    MaximumTemporal
    Laser powerreflectivity ofcontrast
    Laser name or laser facility(TW)PM system designPM system (%)enhancementReferences
    Hercules300Double50105[39]
    BELLA Petawatt Laser1000Single (VHS tape)80[40]
    Scarlet400Single (liquid crystal)75350[28]
    Advanced Laser Light Source200Double55104[41]
    Astra-Gemini500Double65104[42,43]
    Salle Jaune100Double50104[44]
    UHI100100Double50104[45]
    JETI10Single80103[46]
    ATLAS300Double40103–104[47]
    Max-Born-Institute35Double60104[48,49]
    DRACO150 (1000)Single90 (85)102–103[50,51]
    ARCTURUS100Single80102[52]
    POLARIS170Single600[53]
    Lund Laser Center10Double40102[54,55]
    Laboratory for Laser Plasmas200Single70102[56]
    CoReLS 4-PW laser4000Double707×106[57]
    T6-laser10Single70104[58]
    J-KAREN-P200Single85102This work
    Table 1. Performance and design of PM systems in laser facilities around the world.
    Energy onTemporal contrastPulse durationSpot sizePointingPeak intensity
    target (J)at –10 psFWHM (fs)FWHM (μm)(μrad, RMS)(W/cm2)
    Without PM9.0 ± 0.3110–747 ± 1.4X: 1.57X: 1.11(3.8 ± 0.6) × 1021
    Y: 1.65Y: 1.22
    PM5.9 ± 0.2610–945 ± 1.0X: 1.66X: 1.99(2.3 ± 0.3) × 1021
    (0.5 kJ/cm2)(RPM ≃ 65%)Y: 1.59Y: 2.07
    PM7.0 ± 0.34X: 1.66X: 1.99(2.9 ± 0.4) × 1021
    (100 kJ/cm2)(RPM ≃ 83%)Y: 1.59Y: 2.07
    Table 2. Summary of the characteristics of the PM system in J-KAREN-P. Note that the focus spot size and pointing stability are measured with alignment mode laser (<μJ). Note that the PM dataset is from a highly reflective coated part of the PM substrate, rather than an activated PM. The peak intensities are calculated from the on-target energy, pulse duration and focused intensity, respectively.
    Akira Kon, Mamiko Nishiuchi, Yuji Fukuda, Kotaro Kondo, Koichi Ogura, Akito Sagisaka, Yasuhiro Miyasaka, Nicholas P. Dover, Masaki Kando, Alexander S. Pirozhkov, Izuru Daito, Liu Chang, Il Woo Choi, Chang Hee Nam, Tim Ziegler, Hans-Peter Schlenvoigt, Karl Zeil, Ulrich Schramm, Hiromitsu Kiriyama. Characterization of the plasma mirror system at the J-KAREN-P facility[J]. High Power Laser Science and Engineering, 2022, 10(4): 04000e25
    Download Citation