
Daojing Li, Kai Zhou, Anjing Cui, Ming Qiao, Shumei Wu, Yefei Wang, Yuan Yao, Jiang Wu, Jinghan Gao. Multi-Channel Inverse Synthetic Aperture Ladar Imaging Detection Technology and Experimental Research[J]. Laser & Optoelectronics Progress, 2021, 58(18): 1811017
- Laser & Optoelectronics Progress
- Vol. 58, Issue 18, 1811017 (2021)
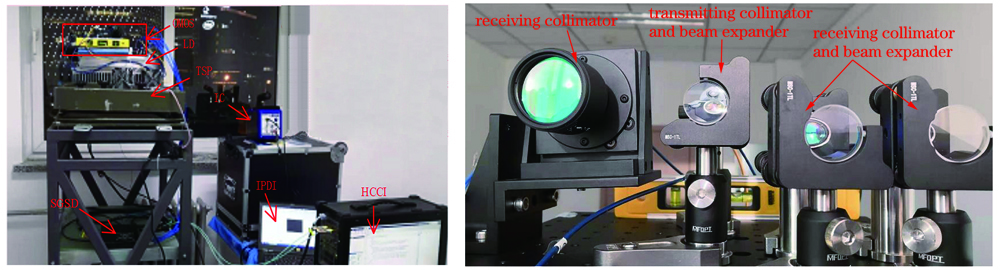
Fig. 1. System of coherent ladar prototype. (a) Experimental photo of prototype; (b) photo of optical system

Fig. 2. Block diagram of prototype system
Fig. 3. (a) AD sampiling signal and (b) SNR when attenuation of input signal is 55 dB and difference frequency is about 279.3 MHz
Fig. 4. Phase curves of signals of adjacent range gates in middle of (a1)--(a3) emission signal and (b1)--(b3) echo signal of stationary target
Fig. 5. Slow time spectrum widths of echo signal of range gate before and after compensation and phase curve after compensation. (a) Slow time spectrum width before compensation; (b) slow time spectrum width after compensation; (c) phase curve after compensation
Fig. 6. (a) Coherence coefficient diagram, (b) coherence coefficient histogram of signal area and (c) interferometry phase diagram of two-channel echo
Fig. 7. Expansion situations of emitting and receiving lateral beams. (a) Laser spot with wavelength of 1550 nm emitted by laser taken by infrared camera; (b) visible red light spot with wavelength of 650 nm emitted by laser emitted by receiving telescope
Fig. 8. Diagrams of two-channel target echo signal and two-channel imaging results before and after phase error compensation。(a1)~(a3) Channel 1; (b1)~(b3) channel 2
Fig. 9. Phase error curve estimated by the along-track interferometry processing and imaging profiles before and after phase error compensation. (a) Phase error curve estimated by the along-track interferometry processing; (b) imaging profile before phase error compensation; (c) imaging profile after phase error compensation
Fig. 10. Diagrams of echo signals, time-frequency analyses and imaging profiles of two-channel signal at a range gate. (a1)--(a3) Channel 1; (b1)--(b3) channel 2
Fig. 11. Range-Doppler domain imaging results of signal of channel 2 obtained by motion compensation based on along-track interferometry processing and time-frequency analysis. (a) Imaging result; (b) imaging result after taking logarithm; (c) imaging profile at the 68th moment
Fig. 12. Echo signal and Range-Doppler domain imaging processing result of uncooperative moving target. (a) Echosignal; (b) Range-Doppler domain imaging result; (c) peak SNR in Doppler frequency domain
Fig. 13. Incoherent accumulation results in Range-Doppler domain. (a) Range-Doppler domain processing result; (b) peak SNR in Doppler frequency domain
Fig. 14. Range super-resolution processing results of range-azimuth image. (a) Channel 1; (b) channel 2
Fig. 15. Range super-resolution result of range-Doppler image
Fig. 16. Range super-resolution results of echo signal. (a) Image result without range super-resolution processing; (b) image result with range super-resolution processing
|
Table 1. Parameters of prototype system

Set citation alerts for the article
Please enter your email address
© Copyright 2018-2021 | Chinese Laser Press. All Rights Reserved 沪ICP备15018463号-20