
Zhe-yu ZHANG, Yao-xiang LI, Zhi-yuan WANG, Chun-xu LI. NIR Model Optimization Study of Larch Wood Density Based on IFSR Abnormal Sample Elimination[J]. Spectroscopy and Spectral Analysis, 2022, 42(11): 3395
- Spectroscopy and Spectral Analysis
- Vol. 42, Issue 11, 3395 (2022)
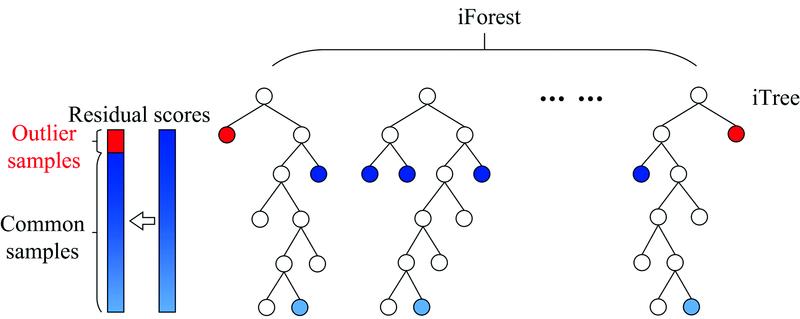
Fig. 1. IFSR algorithm schematic diagram
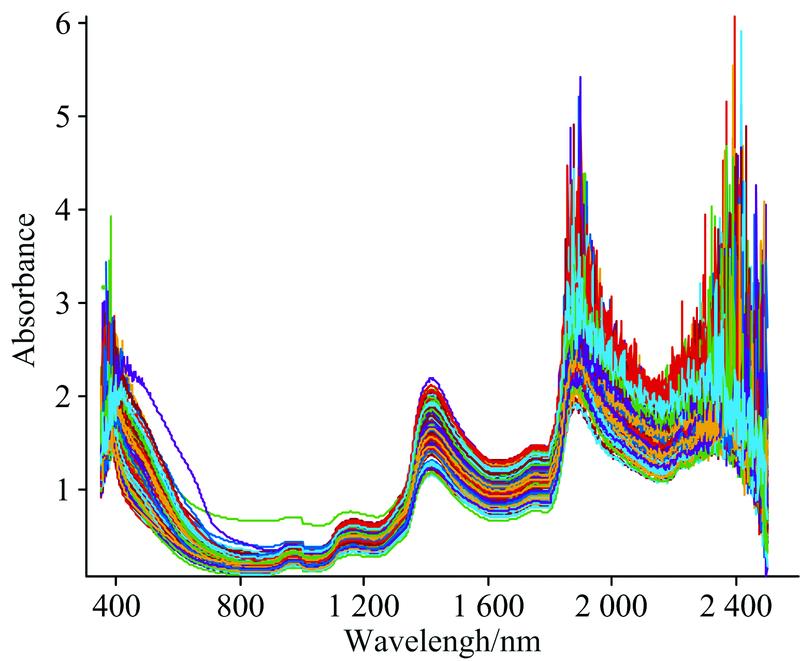
Fig. 2. Original near-infrared spectra of larch wood samples
Fig. 3. CARS band selection trend chart
(a): Number of sampled variables; (b) RMSECV;(c) Variable stability path
(a): Number of sampled variables; (b) RMSECV;(c) Variable stability path
Fig. 4. Results of abnormal sample elimination based on IFSR method
Fig. 5. Sample removal results based on six abnormal sample removal methods
(a): MCCV; (b): MD; (c): HL; (d): HLSR; (e): SR; (f): ODXY
(a): MCCV; (b): MD; (c): HL; (d): HLSR; (e): SR; (f): ODXY
Fig. 6. PSO-SVR prediction results
(a): PSO parameter optimization fitness curve; (b): Fitting curve of correction set and prediction set
(a): PSO parameter optimization fitness curve; (b): Fitting curve of correction set and prediction set
Fig. 7. BPNN prediction set fitting curve
Fig. 8. Prediction results of PSO-SVR model
Fig. 9. Residual analysis of calibration prediction results
|
Table 1. Statistical analysis of correction set and prediction set results (g·cm-3)
| ||||||||||||||||||||||||||||||||||||||||||||||||||||||||||||||||||||||
Table 2. Prediction results of larch wood density based on different pretreatment methods
| |||||||||||||||||||||||||||||||||||||||||||||||||||||||||||||||||||
Table 3. Modeling and prediction results of larch wood density based on different outliers elimination methods
| ||||||||||||||||||||||||
Table 4. Modeling and prediction results of larch wood density based on PSO-SVR, BPNN and PLS methods

Set citation alerts for the article
Please enter your email address
© Copyright 2018-2021 | Chinese Laser Press. All Rights Reserved 沪ICP备15018463号-20