• Photonics Research
  • Vol. 10, Issue 9, 2202 (2022)
Qi Yuan1、†, Cuilian Xu1、†, Jinming Jiang1、*, Yongfeng Li1、2, Yang Cheng1, He Wang1, Mingbao Yan1, Jiafu Wang1, Hua Ma1, and Shaobo Qu1
Author Affiliations
  • 1Department of Basic Science, Air Force Engineering Universityhttps://ror.org/00seraz22, Xi’an 710051, China
  • 2e-mail: liyf217130@126.com
  • show less
    DOI: 10.1364/PRJ.467612 Cite this Article Set citation alerts
    Qi Yuan, Cuilian Xu, Jinming Jiang, Yongfeng Li, Yang Cheng, He Wang, Mingbao Yan, Jiafu Wang, Hua Ma, Shaobo Qu. General strategy for ultrabroadband and wide-angle absorbers via multidimensional design of functional motifs[J]. Photonics Research, 2022, 10(9): 2202 Copy Citation Text show less
    Schematic diagram of the proposed functional motifs with optical transparency and microwave absorption in wide range and broadband.
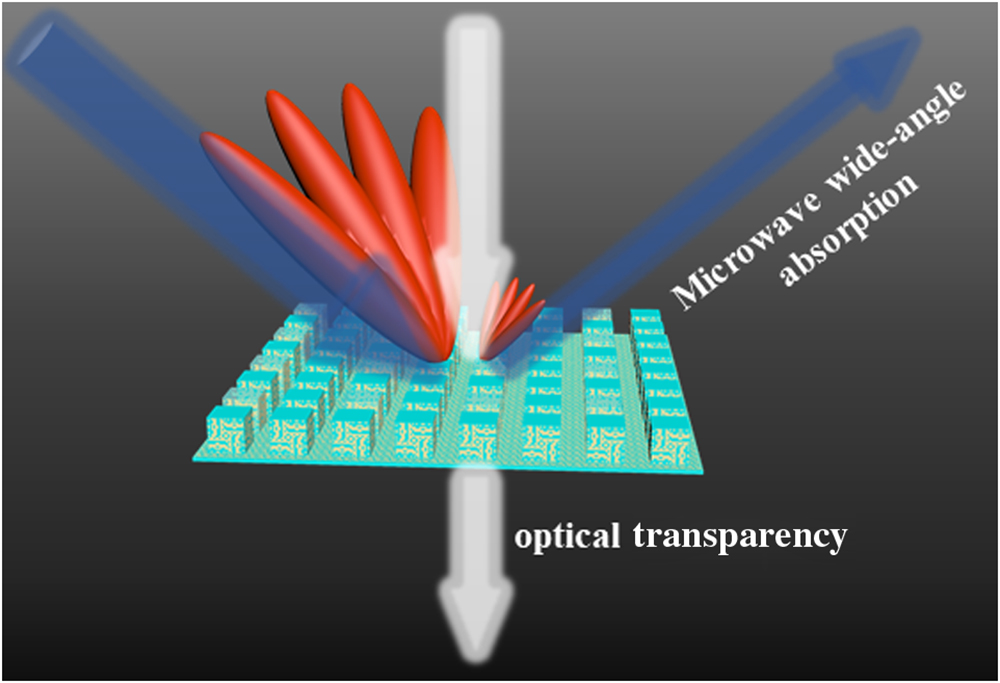
    Fig. 1. Schematic diagram of the proposed functional motifs with optical transparency and microwave absorption in wide range and broadband.
    Vector decomposition of incident waves.
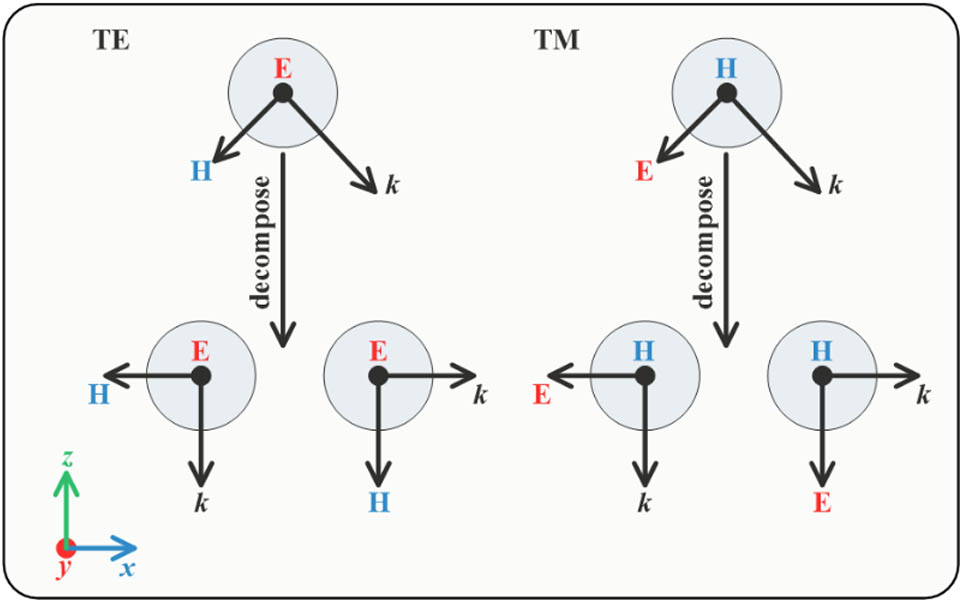
    Fig. 2. Vector decomposition of incident waves.
    Absorbing mechanism of the proposed functional motifs. (a) Small incident angle; (b) large incident angle.
    Fig. 3. Absorbing mechanism of the proposed functional motifs. (a) Small incident angle; (b) large incident angle.
    (a) Functional motifs of the proposed absorber with top, bottom, and back-plane structures, where the square resistance of the ITO back plane is 6 Ω/sq. (b) and (c) are the coding matrix and topology optimization strategy of top and bottom structures, respectively.
    Fig. 4. (a) Functional motifs of the proposed absorber with top, bottom, and back-plane structures, where the square resistance of the ITO back plane is 6 Ω/sq. (b) and (c) are the coding matrix and topology optimization strategy of top and bottom structures, respectively.
    Simulation curves of absorption. Reflection curves of (a) TE and (c) TM waves at 0°, 40°, 60°, and 70°, respectively; absorption characteristics of (b) TE and (d) TM waves from 0° to 80°, respectively.
    Fig. 5. Simulation curves of absorption. Reflection curves of (a) TE and (c) TM waves at 0°, 40°, 60°, and 70°, respectively; absorption characteristics of (b) TE and (d) TM waves from 0° to 80°, respectively.
    Absorption curves of spatial combined, top, and bottom structures. (a)–(d) Absorption of TE wave at 0°, 40°, 60°, and 70°, respectively; (e)–(h) absorption of TM wave at 0°, 40°, 60°, and 70°, respectively.
    Fig. 6. Absorption curves of spatial combined, top, and bottom structures. (a)–(d) Absorption of TE wave at 0°, 40°, 60°, and 70°, respectively; (e)–(h) absorption of TM wave at 0°, 40°, 60°, and 70°, respectively.
    Loss distribution of different incident angles and polarization at their own maximum resonance peaks. (a) For 0°, both TE and TM at 8.9 GHz; (b) for 40°, TE at 21.1 GHz and TM at 23.1 GHz; (c) for 60°, TE at 3.4 GHz and TM at 31.3 GHz; (d) for 70°, TE at 3.5 GHz and TM at 7.1 GHz.
    Fig. 7. Loss distribution of different incident angles and polarization at their own maximum resonance peaks. (a) For 0°, both TE and TM at 8.9 GHz; (b) for 40°, TE at 21.1 GHz and TM at 23.1 GHz; (c) for 60°, TE at 3.4 GHz and TM at 31.3 GHz; (d) for 70°, TE at 3.5 GHz and TM at 7.1 GHz.
    (a) Simulated 3D far-field patterns under normal incidence at 8, 14, 22, and 28 GHz; (b) simulated monostatic RCS of the designed absorber and group metal from 2 to 40 GHz.
    Fig. 8. (a) Simulated 3D far-field patterns under normal incidence at 8, 14, 22, and 28 GHz; (b) simulated monostatic RCS of the designed absorber and group metal from 2 to 40 GHz.
    2D far-field patterns of both absorber and group metal from 4 to 32 GHz in range of 0° to 70° incidences. (a) 0°, (b) 40°, (c) 60°, and (d) 70°. The yellow values mark the value of maximum RCS points, and the range of minimum to maximum is over 25 dB.
    Fig. 9. 2D far-field patterns of both absorber and group metal from 4 to 32 GHz in range of 0° to 70° incidences. (a) 0°, (b) 40°, (c) 60°, and (d) 70°. The yellow values mark the value of maximum RCS points, and the range of minimum to maximum is over 25 dB.
    (a) Photograph of the fabricated prototype with the inset showing the functional motifs; (b) experimental setup of mirror reflection measurement; (c) and (d) measured reflection curves of TE and TM waves under 0°, 40°, 60°, and 70° incidences, respectively; (e) measured optical transmittance of the prototype, where red and blue lines represent the transmittance of the red and blue arrow incident types, respectively.
    Fig. 10. (a) Photograph of the fabricated prototype with the inset showing the functional motifs; (b) experimental setup of mirror reflection measurement; (c) and (d) measured reflection curves of TE and TM waves under 0°, 40°, 60°, and 70° incidences, respectively; (e) measured optical transmittance of the prototype, where red and blue lines represent the transmittance of the red and blue arrow incident types, respectively.
    Flow chart of the joint simulation.
    Fig. 11. Flow chart of the joint simulation.
    Coding expression of the structure parameters.
    Fig. 12. Coding expression of the structure parameters.
    Power loss density of the proposed functional motifs under different incident angles and polarization at each resonant peak. (a) 0°, (b) 40°, (c) 60°, and (d) 70°.
    Fig. 13. Power loss density of the proposed functional motifs under different incident angles and polarization at each resonant peak. (a) 0°, (b) 40°, (c) 60°, and (d) 70°.
    Qi Yuan, Cuilian Xu, Jinming Jiang, Yongfeng Li, Yang Cheng, He Wang, Mingbao Yan, Jiafu Wang, Hua Ma, Shaobo Qu. General strategy for ultrabroadband and wide-angle absorbers via multidimensional design of functional motifs[J]. Photonics Research, 2022, 10(9): 2202
    Download Citation