
Hao Wang, Wenxiong Kang, Xiaopeng Chen. Palm Print and Palm Vein Joint Recognition System Based Video[J]. Acta Optica Sinica, 2018, 38(2): 0215004
- Acta Optica Sinica
- Vol. 38, Issue 2, 0215004 (2018)
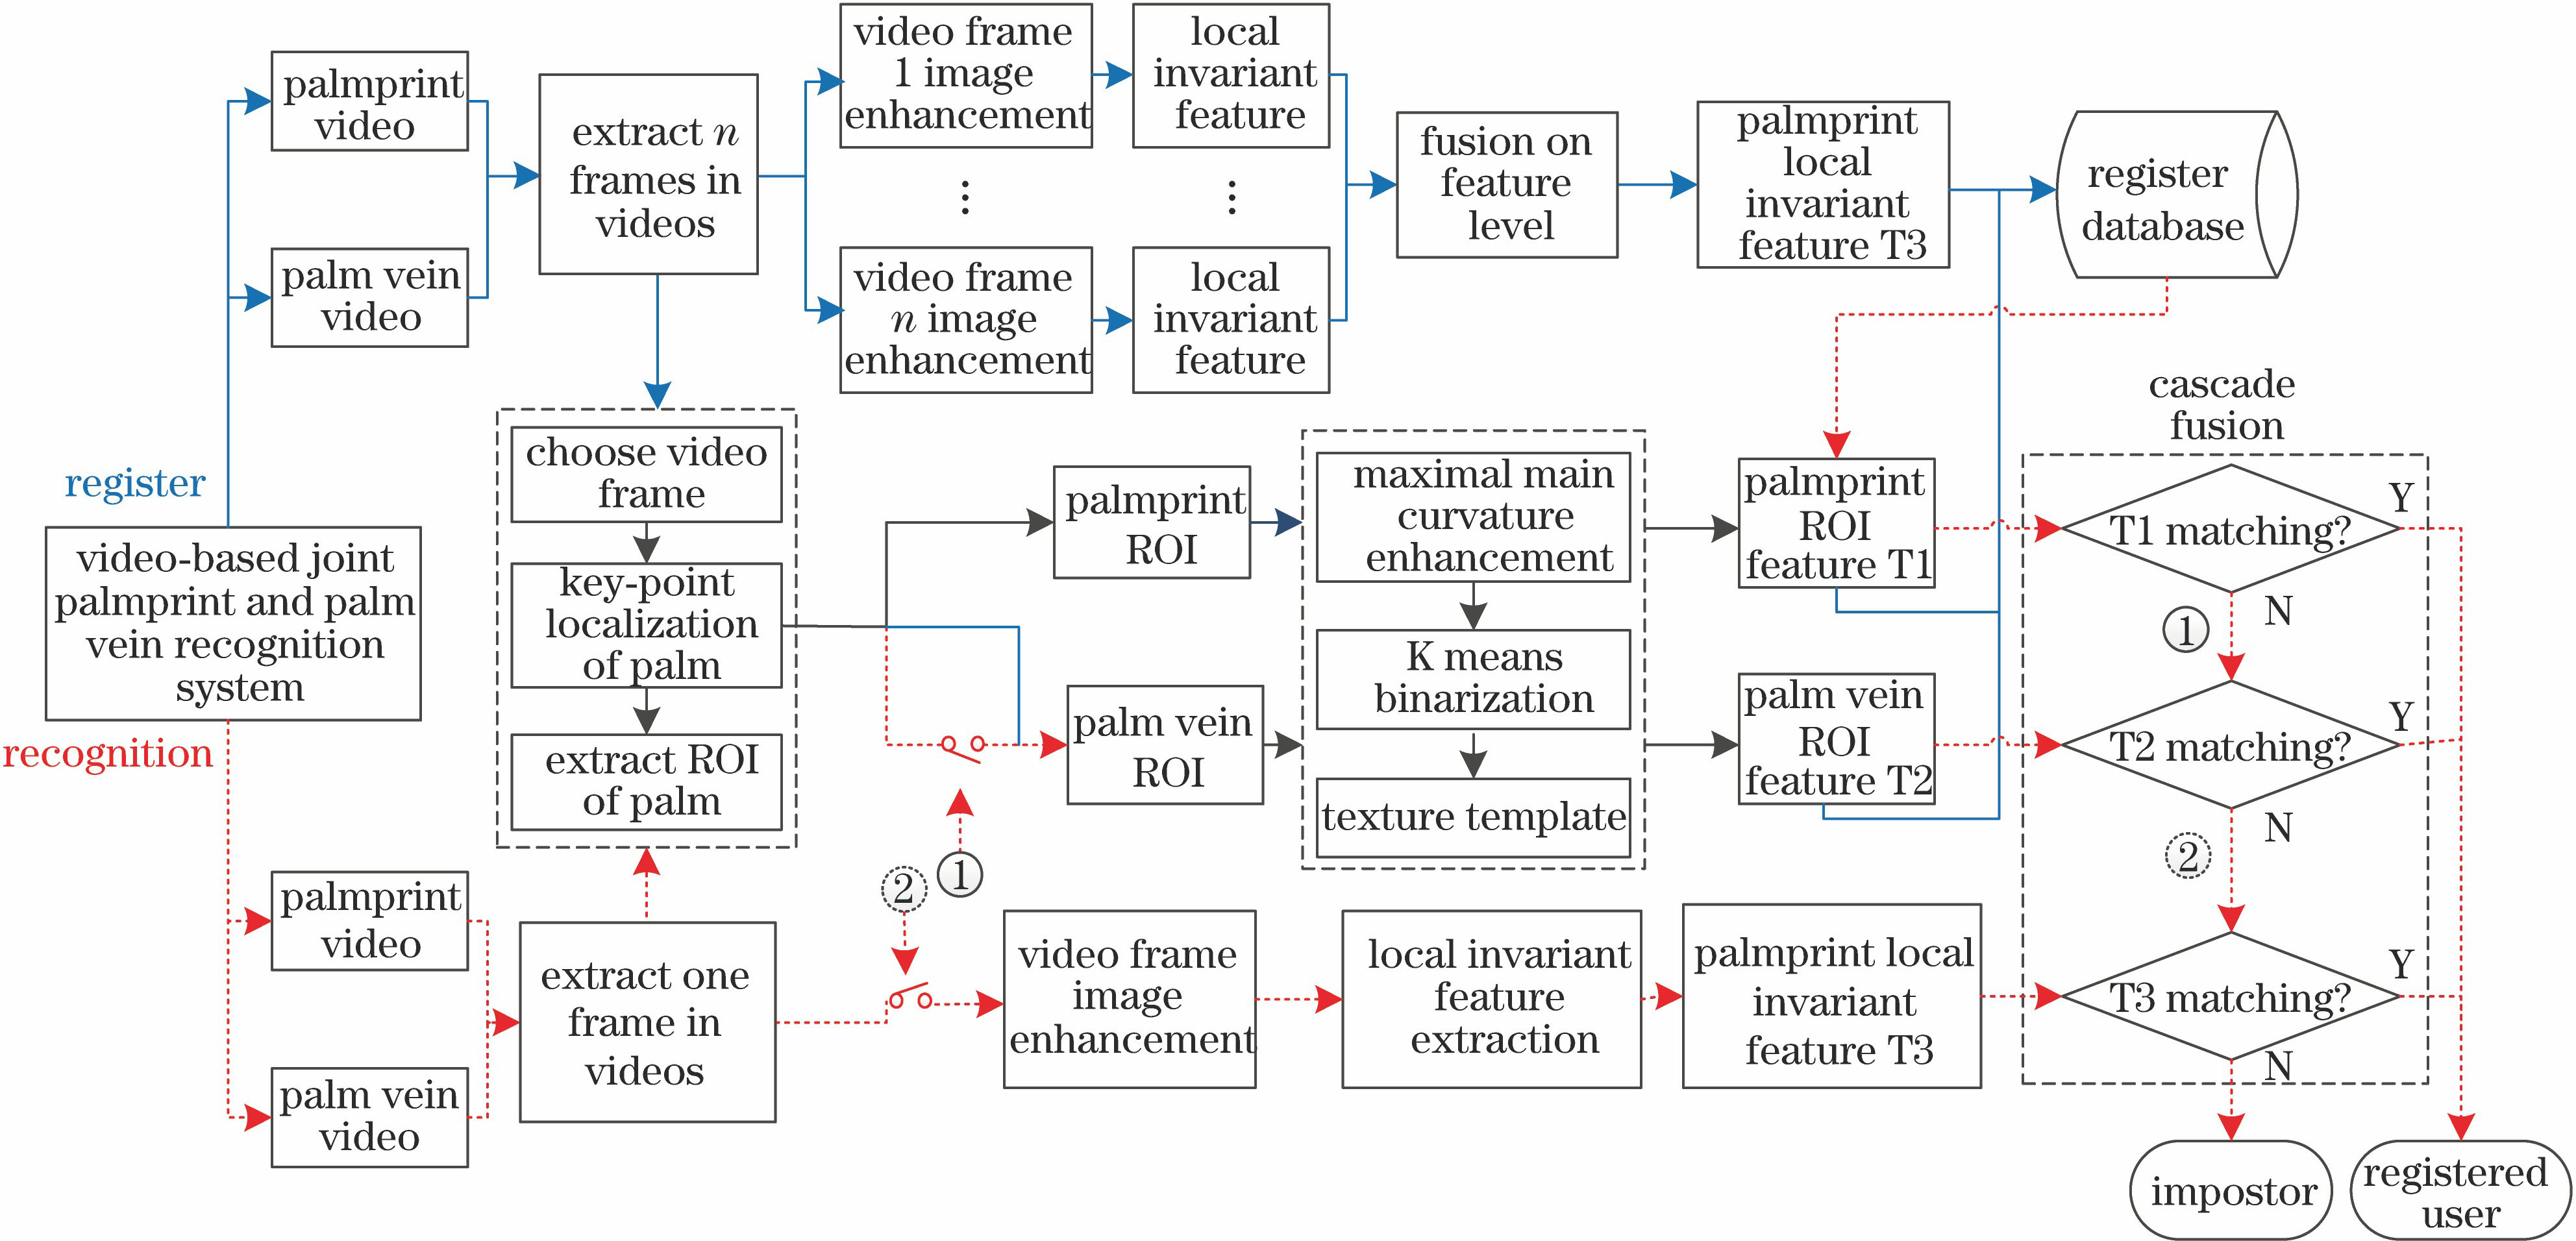
Fig. 1. Working flow chart of recognition system
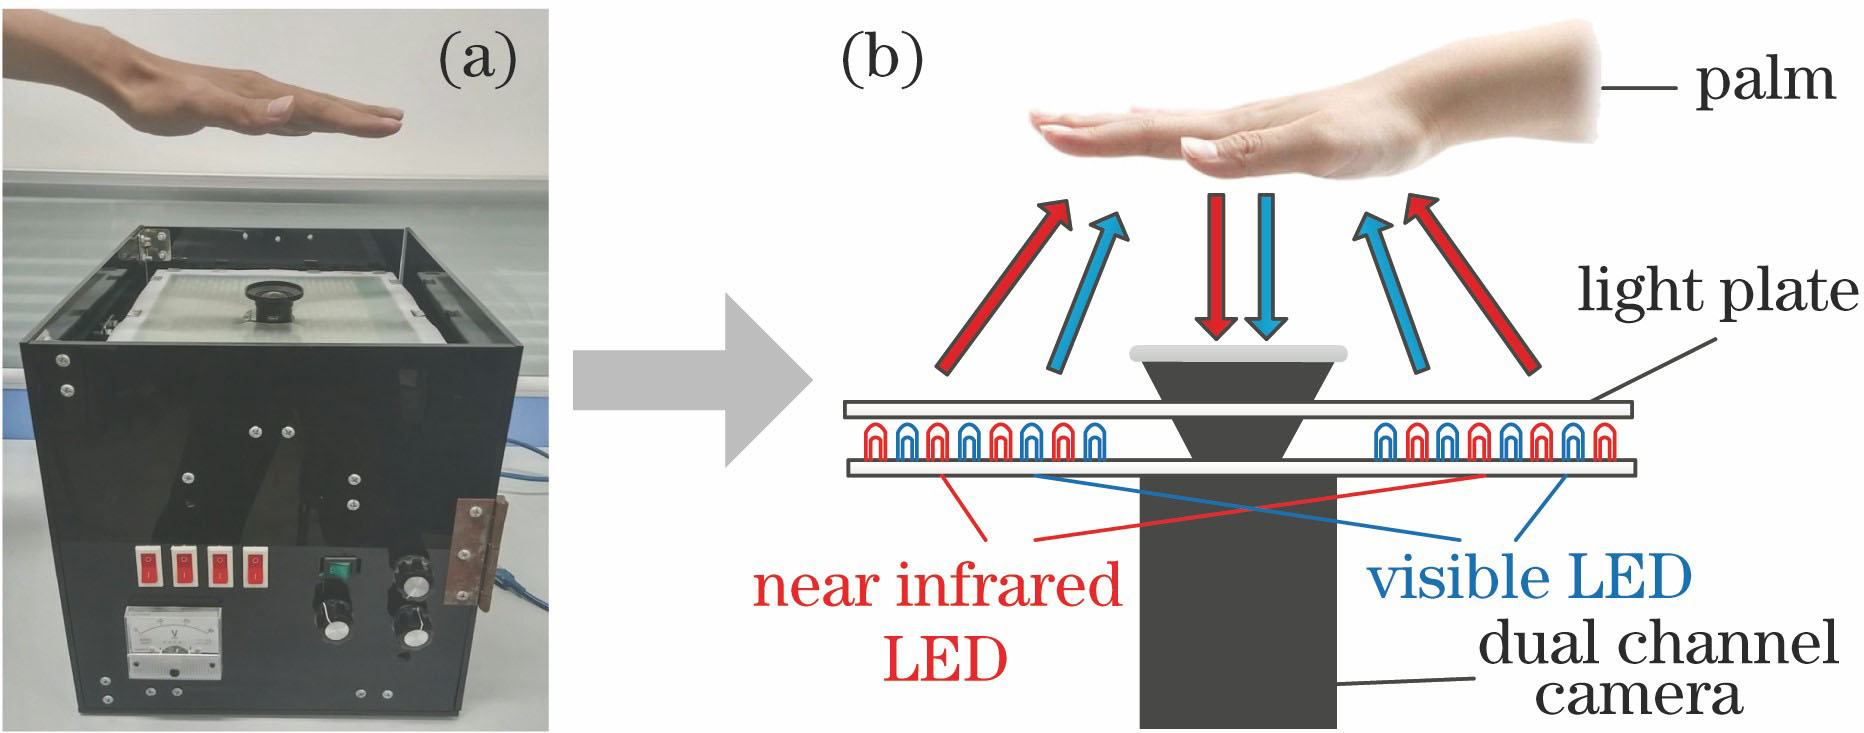
Fig. 2. Hardware model of recognition system. (a) Overall appearance; (b) diagram of internal structure
Fig. 3. Selected images chosen from rotating video
Fig. 4. Selected images chosen from sweeping video
Fig. 5. Extraction steps of palm texture template. (a) Obtained palm vein image; (b) ROI of palm vein; (c) normalized ROI of palm vein; (d) enhanced image; (e) binary image
Fig. 6. Process of feature point detection. (a) ROI of palm print; (b) distribution schematic of fixed grids; (c) detected result of feature points
Fig. 7. Recognition flow charts of weighted fusion/SVM fusion and cascade fusion. (a) Weighted fusion/SVM fusion; (b) cascade fusion
Fig. 8. Distribution curves of recognition performance. (a) Similarity score of template matching; (b) similarity score of MF_LBP matching; (c) EER
Fig. 9. Performance comparison of SIFT and FRDOH. (a) Recognition equal error rate; (b) computational efficiency
Fig. 10. Comparison of effects of score level fusion modes
|
Table 1. Simulation results of template matching, MF_LBP matching and cascade fusion matching of palm vein
|
Table 2. Comparison of recognition equal error rate under multi-frame feature fusion
|
Table 3. Time-consuming comparison of different feature extraction and matching

Set citation alerts for the article
Please enter your email address
© Copyright 2018-2021 | Chinese Laser Press. All Rights Reserved 沪ICP备15018463号-20