
Yuan Han, Gang Zheng, Xiongxing Zhang, Qiming Sheng, Lang Bai. Frequency Modulation Continuous Wave Displacement Sensor Based on STM32H743[J]. Laser & Optoelectronics Progress, 2021, 58(11): 1112007
- Laser & Optoelectronics Progress
- Vol. 58, Issue 11, 1112007 (2021)
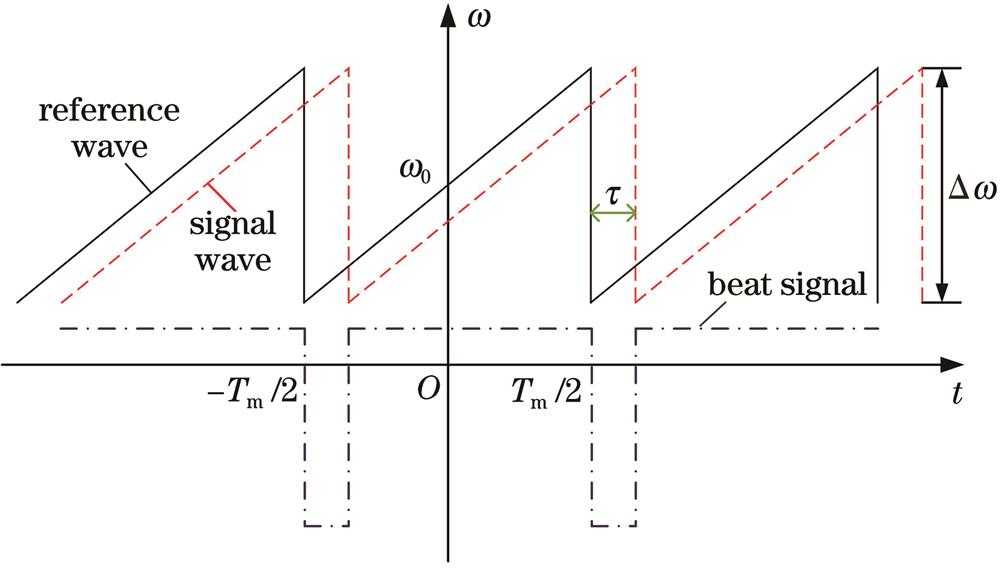
Fig. 1. Angular frequency relationship between interference wave and beat signal in FMCW laser interference
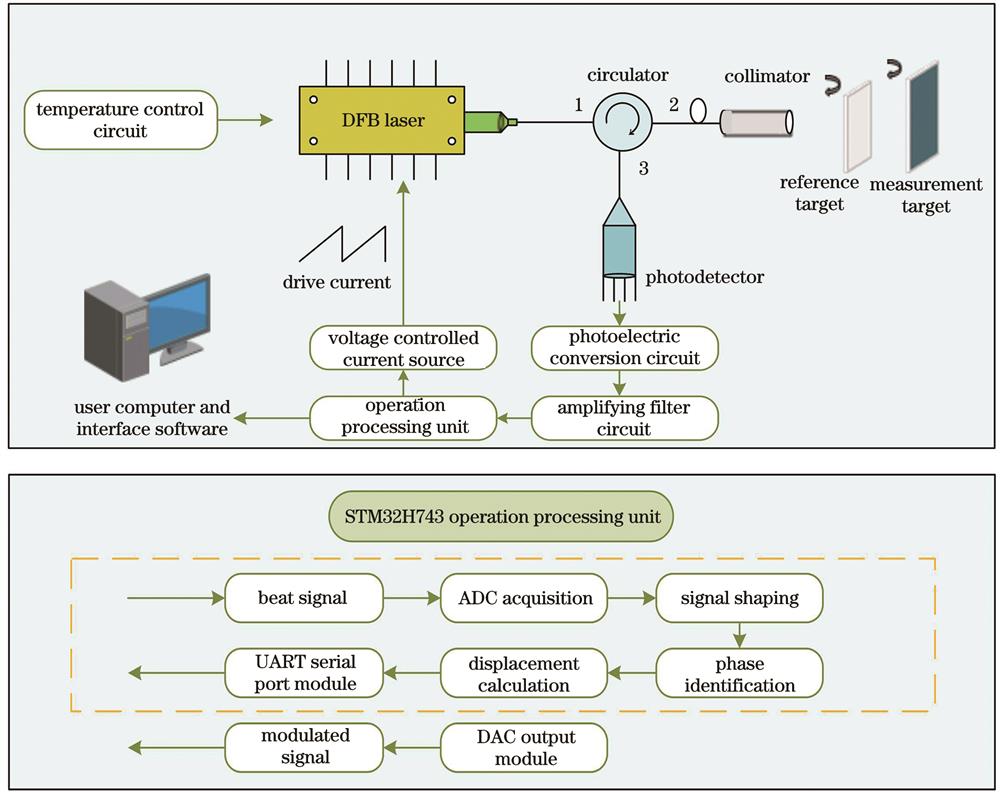
Fig. 2. Optical fiber FMCW laser interferometer displacement measurement system block diagram
Fig. 3. Schematic diagram of optical interference system structure
Fig. 4. Frequency modulated continuous wave laser interferometric schematic diagram of displacement measurement system
Fig. 5. Overall block diagram of signal processing circuit
Fig. 6. Fixed wavelength experimental setup diagram
Fig. 7. Experimental measurement results of cavity length fluctuations. (a) Random error of cavity length fluctuation;(b) histogram of random error of cavity length fluctuation
Fig. 8. Experimental device diagram of optical fiber FMCW interference displacement measurement
Fig. 9. Scatter plots and distribution plots of the measurement results of fixed point targets at different locations. (a)(c)(e) Scatter plots of measurement results at 200 mm, 400 mm, and 600 mm, respectively; (b)(d)(f) distribution plots of measurement results at 200 mm, 400 mm, and 600 mm, respectively
Fig. 10. Standard deviation distribution of measurement results of fixed point targets at different locations
Fig. 11. Linearity measurement results of the moving target under sawtooth wave modulation. (a) Measurement result of 200‒400 mm; (b) measurement result of 0‒600 mm
Fig. 12. Repeatability measurement experiment diagram. (a) Four repeated measurement results of 200‒400 mm;(b) four repeated measurement results of 0‒600 mm
|
Table 1. Displacement measurement results at different movement speeds

Set citation alerts for the article
Please enter your email address
© Copyright 2018-2021 | Chinese Laser Press. All Rights Reserved 沪ICP备15018463号-20