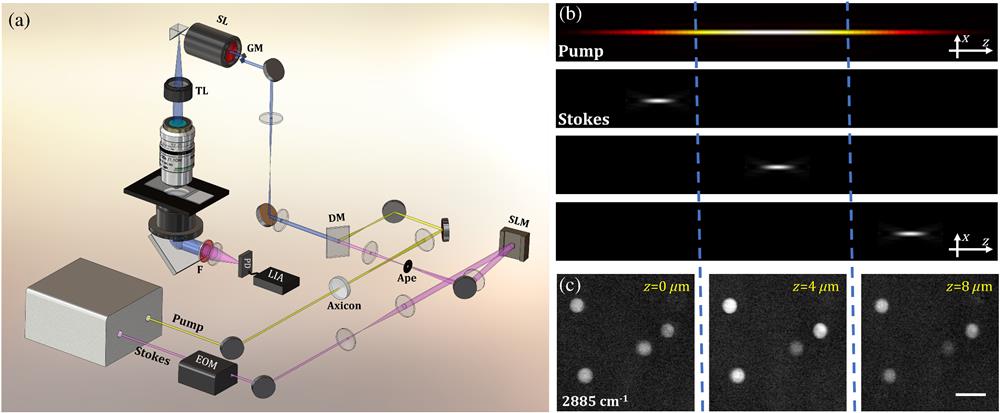
Fig. 1. (a) Schematic of PM-SRST system for 3D chemical imaging. EOM, electro-optical modulator; SLM, spatial light modulator; Ape, aperture; DM, dichroic mirror; GM, galvo mirror; SL, scan lens; TL, tube lens; F, filter; LIA, lock-in amplifier; PD, photodiode. (b) Schematic of the working principle of PM-SRST. The pump beam is converted into a Bessel beam, and the Stokes beam is focused into the sample. The depth-resolved SRS image is achieved by manipulating the axial position of the focused Gaussian Stokes beam and the overlapping with the needle Bessel pump beam at different depths by SLM. (c) Raw SRS images of PS beads ( of asymmetric stretching) measured at , , and , respectively, by PM-SRST. Scale bar . for bead imaging. Average powers of the pump and Stokes beams are 5 and 40 mW on the sample.
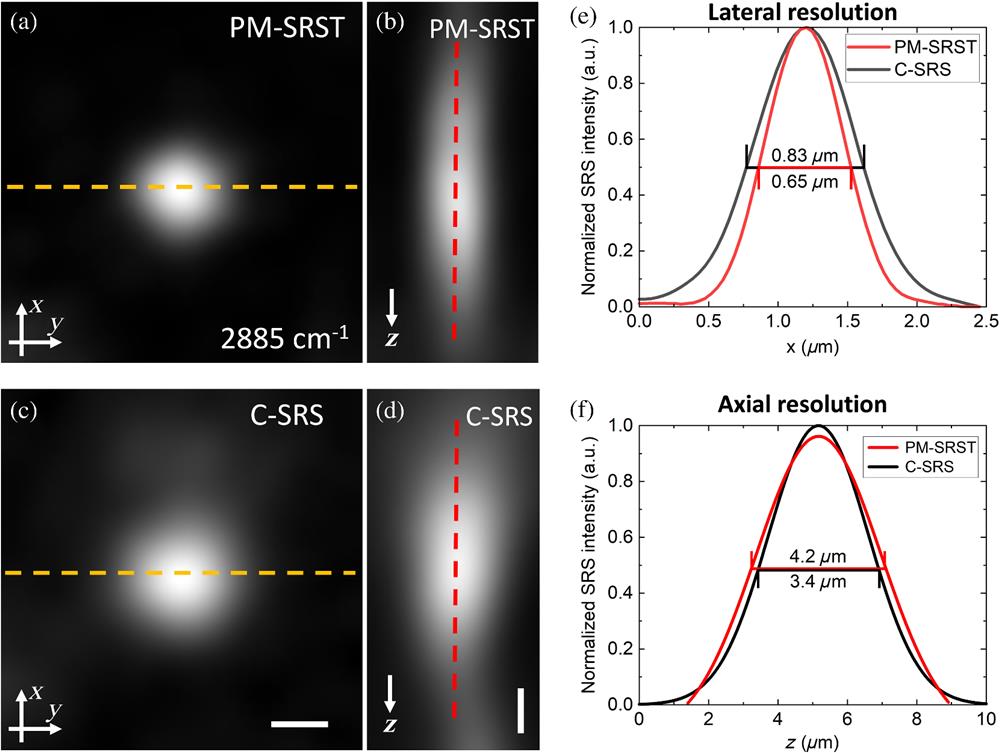
Fig. 2. (a) and (c) Lateral SRS images ( of asymmetric stretching) of the 500 nm PS bead measured by PM-SRST and C-SRS imaging. Scale bar: 500 nm. (b) and (d) Axial SRS images of the 500 nm PS bead measured by PM-SRST and C-SRS imaging. Scale bar: . for beads imaging. Average powers of the pump beam are 10 mW for PM-SRST and 2 mW for C-SRS, with the Stokes beam power of 35 mW on the beads. (e) SRS intensity distribution along the dashed line in (a) and (c) with the estimated FWHMs for PM-SRST () and C-SRS imaging (). (f) SRS intensity distribution along the dashed red line in (b) and (d) with the estimated FWHMs for PM-SRST () and C-SRS imaging ().
Fig. 3. (a) PS beads volume in gel phantom ( of asymmetric stretching) measured by PM-SRST and C-SRS imaging. The yellow solid arrows indicate the brighter PS bead at the deep position obtained by PM-SRST as compared to C-SRS. Scale bar: . Image volume: . for 2D scanning, axial step size of . Total 26 depths and 7.4 s time for one 3D volume acquisition. Average powers of the pump beam are 15 mW for PM-SRST and 2 mW for C-SRS, with the Stokes beam power of 30 mW on the beads. (b) Comparison of the normalized SRS intensities of PS beads at different depths by PM-SRST and C-SRS techniques. The SRS intensities of the beads at different depths are normalized to the intensity at the top layer (i.e., ) for better comparison. (c) Dynamic 3D SRS images ( of asymmetric stretching) of PS beads in water. Scale bar: . Image volume: . for 2D scanning, axial step size of . Total six depths and 0.118 s acquisition time for obtaining one 3D volume (8.5 Hz). Average powers of the pump and Stokes beams are 8 and 40 mW, respectively, on the beads (Video 1, mp4, 630 KB [URL: https://doi.org/10.1117/1.AP.6.2.026001.s1]).
Fig. 4. (a) 3D diffusion dynamics of (SRS at of O-D chemical bond) into the plant’s root over time by PM-SRST. Scale bar: . Image volume: . for 2D scanning, axial step size of . Total six depths and 1.46 s acquisition time for one 3D volume. Average powers of 11 mW (pump beam 824 nm) and 40 mW (Stokes beam) used for SRS imaging of . (b) and (c) The 3D images of the root at (pump beam is set as 824 nm) and ( asymmetric stretching). Scale bar: . Image volume: . Average powers of 10 mW (pump beam 800 nm) and 40 mW (Stokes beam) on the root. (d) Merged image of the root and the distribution of at . (e) Linear relationship of SRS intensity versus concentration. (f) SRS intensity at each depth for the intensity and concentration calibration of in (g) and (i). (g) SRS signal temporal variations and fit results with correlation coefficients (R) at different root depths. (h) Diffusion permeability of versus tissue depth calculated from (g). (i) Concentration change of with tissue depth (Video 2, mp4, 85.6 KB [URL: https://doi.org/10.1117/1.AP.6.2.026001.s2]).
Fig. 5. (a) 3D SRS dynamics of MCF-7 cells ( of stretching of lipids and proteins) subjected to 0.4% acetic acid observed by PM-SRST. Red arrows indicate the intensity variation of the nucleus over time. Scale bar: . Image volume: . for 2D scanning, axial step size of . Total seven depths and 1.67 s acquisition time for obtaining one 3D volume. Average powers of the pump (797 nm) and Stokes beams are 10 and 40 mW on the cells. (b) Dynamic variations of MCF-7 cells ( of symmetric stretching of lipids; pump beam is set as 805 nm) exposed to 0.4% acetic acid by PM-SRST. Black arrows indicate the intensity variation inside the cytoplasm over time. Scale bar: . Image volume: . for 2D scanning; axial step size of . Total four depths and 1.29 s acquisition time for one 3D volume. Average powers of the pump (804 nm) and Stokes beams are 10 and 40 mW, respectively, on the cells. (c) SRS intensity change of the nucleus (black dot line) and the reduction of nucleus volume (red dotted line) over time for the cell in (a). (d) and (e) SRS intensity variation in the cytoplasm versus time at different depths for the cells in (a) and (b), respectively (Video 3, mp4, 165 KB [URL: https://doi.org/10.1117/1.AP.6.2.026001.s3] and Video 4, mp4, 217 KB [URL: https://doi.org/10.1117/1.AP.6.2.026001.s4]).
Fig. 6. (a) and (b) SRS 3D images ( of asymmetric stretching of lipids) of the porcine skin tissue obtained using PM-SRST and C-SRS techniques. Scale bar: . Image volume: . for 2D scanning, axial step size of . Total 33 depths and 9.4 s acquisition time for getting one 3D volume. Average powers of the pump beam are 2.5 mW for PM-SRST and 0.5 mW for C-SRS, with the Stokes beam power of 13.5 mW on porcine skin. (c) and (d) plane view of (a) and (b). Scale bar: . (e) Comparison of SRS intensities at different depths in porcine skin tissue using PM-SRST and C-SRS techniques. The SRS intensities at each depth in porcine skin are normalized to the intensity in the top-layer () for imaging performance comparison between PM-SRST and C-SRS. (f) and (g) SRS 3D images () of the porcine brain tissue captured by PM-SRST and C-SRS imaging. Scale bar: . Image volume: . for 2D scanning; axial step size of . Total 17 depths and 4.9 s acquisition time for one 3D volume. Average powers of the pump beam are 6 mW for PM-SRST and 1 mW for C-SRS, with the Stokes beam power of 33 mW on porcine brain. (h) and (i) plane view of (f) and (g). Scale bar: . (j) Comparison of the SRS intensities at each tissue depth in porcine brain using PM-SRST and C-SRS. The SRS intensities at each depth in the porcine brain are normalized to the intensity in the top layer () for the imaging performance comparison between PM-SRST and C-SRS.