• Chinese Optics Letters
  • Vol. 19, Issue 10, 101402 (2021)
Xiufang Wang1, Lina Feng1, Peng Chen1、*, Zhen Huang2, and Ye Yuan3
Author Affiliations
  • 1College of Electrical and Information Engineering, Northeast Petroleum University, Daqing 163318, China
  • 2School of Physics Science and Technology, Lingnan Normal University, Zhanjiang 524048, China
  • 3School of Instrumentation Science and Engineering, Harbin Institute of Technology, Harbin 150001, China
  • show less
    DOI: 10.3788/COL202119.101402 Cite this Article Set citation alerts
    Xiufang Wang, Lina Feng, Peng Chen, Zhen Huang, Ye Yuan. Micro displacement reconstruction of self-mixing grating interferometer based on Littrow structure[J]. Chinese Optics Letters, 2021, 19(10): 101402 Copy Citation Text show less
    Schematic diagram of SMGI.
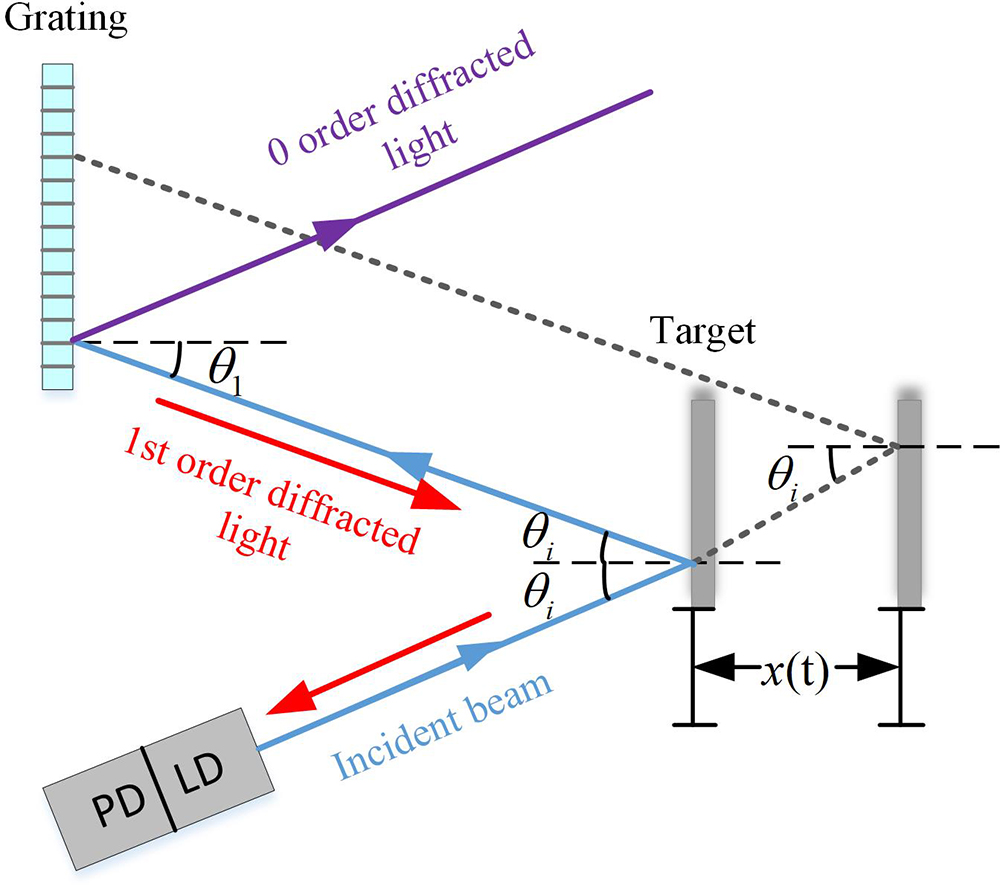
    Fig. 1. Schematic diagram of SMGI.
    Grating diffraction principle diagram.
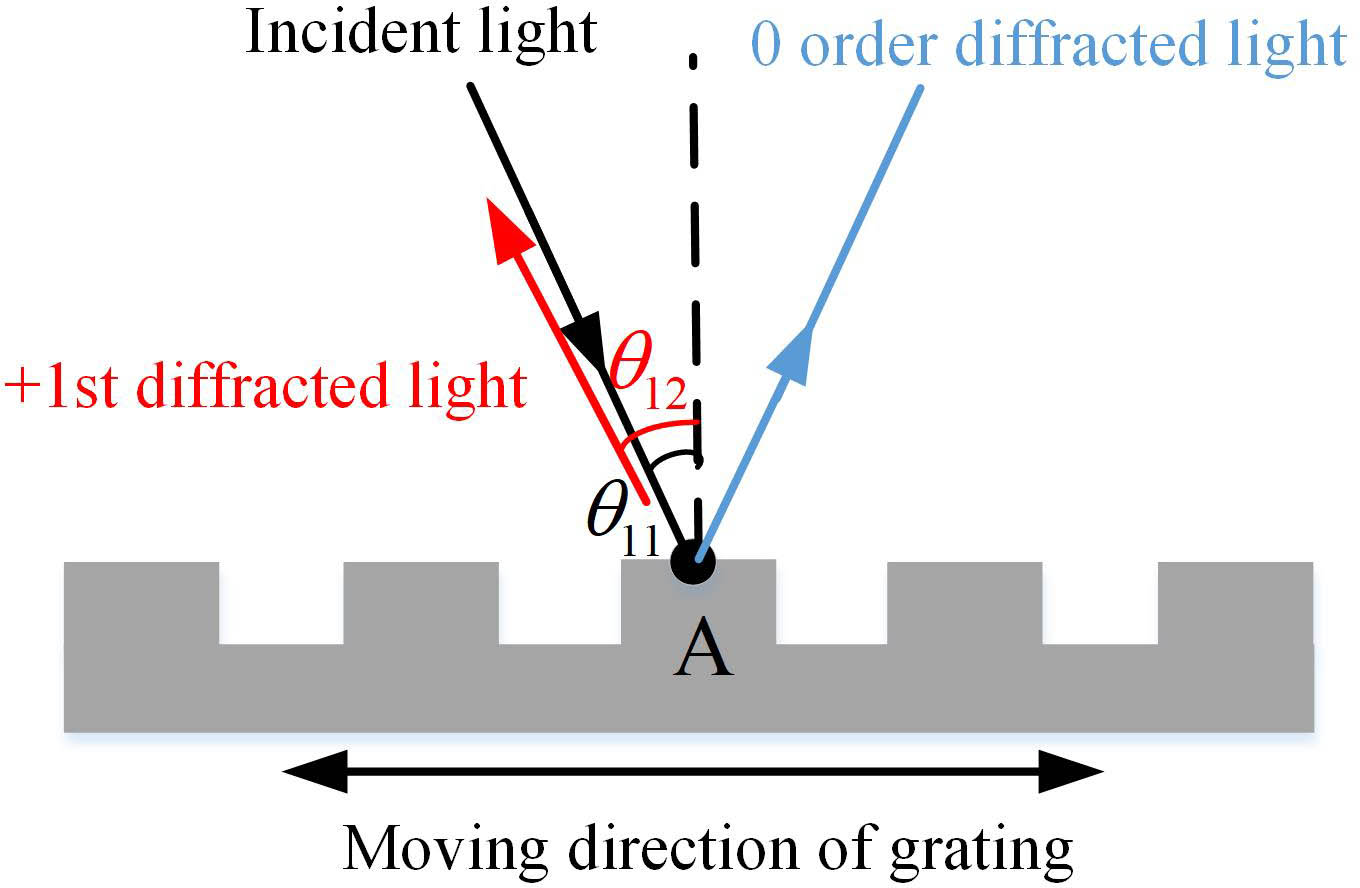
    Fig. 2. Grating diffraction principle diagram.
    Flow chart of integral reconstruction algorithm.
    Fig. 3. Flow chart of integral reconstruction algorithm.
    Simulation harmonic vibration signals (C=0.1, α=4.6). (a) Interference signals. (b) Phase of the measured signals obtained by the integral reconstruction method. (c) Simulated target displacement (red) and reconstruction displacement (blue). (d) Errors.
    Fig. 4. Simulation harmonic vibration signals (C=0.1, α=4.6). (a) Interference signals. (b) Phase of the measured signals obtained by the integral reconstruction method. (c) Simulated target displacement (red) and reconstruction displacement (blue). (d) Errors.
    Experimental setup.
    Fig. 5. Experimental setup.
    Experimental results of sinusoidal vibration. (a) Interference signals. (b) Filtered interference signals. (c) Reconstruction displacement (blue) and theoretical target displacement (red). (d) Errors.
    Fig. 6. Experimental results of sinusoidal vibration. (a) Interference signals. (b) Filtered interference signals. (c) Reconstruction displacement (blue) and theoretical target displacement (red). (d) Errors.
    Experimental results of random vibration. (a) Interference signals. (b) Filtered interference signals. (c) Reconstruction displacement (blue) and theoretical target displacement (red). (d) Errors.
    Fig. 7. Experimental results of random vibration. (a) Interference signals. (b) Filtered interference signals. (c) Reconstruction displacement (blue) and theoretical target displacement (red). (d) Errors.
    SymbolPhysical MeaningValue in This Letter
    CFeedback level parameter0 < C < 1
    αLine-width enhancement factor4.6
    mDiffraction orderm=1,2,3
    θmReflected angle of the mth diffracted light
    θ1Reflected angle of the +1st diffracted light
    θiIncident angle of the light
    dGrating pitch1/1200 mm
    λLaser wavelength650 nm
    cSpeed of light3×108m/s
    Table 1. Physical Meaning of Symbols in Equations
    Peak-to-Peak Amplitude (µm)Frequency (Hz)Maximum Absolute Error (nm)Average Absolute Error (nm)
    2246.4713.04
    344.2712.45
    446.6515.69
    546.9114.09
    Table 2. Errors of Sinusoidal Vibration
    Xiufang Wang, Lina Feng, Peng Chen, Zhen Huang, Ye Yuan. Micro displacement reconstruction of self-mixing grating interferometer based on Littrow structure[J]. Chinese Optics Letters, 2021, 19(10): 101402
    Download Citation