
Xiufang Wang, Lina Feng, Peng Chen, Zhen Huang, Ye Yuan. Micro displacement reconstruction of self-mixing grating interferometer based on Littrow structure[J]. Chinese Optics Letters, 2021, 19(10): 101402
- Chinese Optics Letters
- Vol. 19, Issue 10, 101402 (2021)
Abstract
1. Introduction
The laser self-mixing interferometer (SMI) has been widely used in many measurement fields because of its noncontact, simple structure, easy collimation, high sensitivity, and small measurement errors, including absolute distance[
The grating interferometer (GI) based on the grating Doppler effect was developed. GI is based on the grating pitch as the measurement reference; it has low requirement on the stability of the light source, which reduces the impact of the wavelength fluctuation of the light on the measurement accuracy to a certain extent[
We propose an improved SMGI based on the Littrow structure in this Letter. The displacement measurement using the grating pitch instead of the wavelength of the light source as the measurement standard is realized under the condition that the grating is integrated inside the interferometer. This structure can reduce the impact on vibration parameters. Furthermore, limited by the diffraction efficiency of the grating, an external attenuator is unnecessary to maintain the feedback level in a weak regime. Evidently, the structure is simple, compact, and easy to operate. In addition, the integral reconstruction method can be used to demodulate the phase of the vibrating target, and then the displacement of the target can be obtained using the relationship between the phase and the displacement. This proposed interferometer realizes accurate micro displacement reconstruction with its simple and compact structure.
Sign up for Chinese Optics Letters TOC. Get the latest issue of Chinese Optics Letters delivered right to you!Sign up now
2. Theoretical Analysis
The meanings of some major constant parameters in the following equations are shown in Table 1. The classical SMI model is deduced from the Fabry–Perot (F-P) model, in which SMI occurs when part of the light emitted by the laser is reflected or scattered by the vibrating object and returns to the laser cavity. According to the self-mixing effect, the feedback light is coupled with the light in the cavity, and the coupled light modulates the frequency and intensity of the output light[
| Symbol | Physical Meaning | Value in This Letter |
|---|---|---|
| C | Feedback level parameter | 0 < C < 1 |
| Line-width enhancement factor | 4.6 | |
| m | Diffraction order | m |
| θm | Reflected angle of the mth diffracted light | |
| θ1 | Reflected angle of the | |
| θi | Incident angle of the light | |
| d | Grating pitch | 1/1200 mm |
| Laser wavelength | 650 nm | |
| c | Speed of light |
Table 1. Physical Meaning of Symbols in Equations
Given the weak feedback regime, [
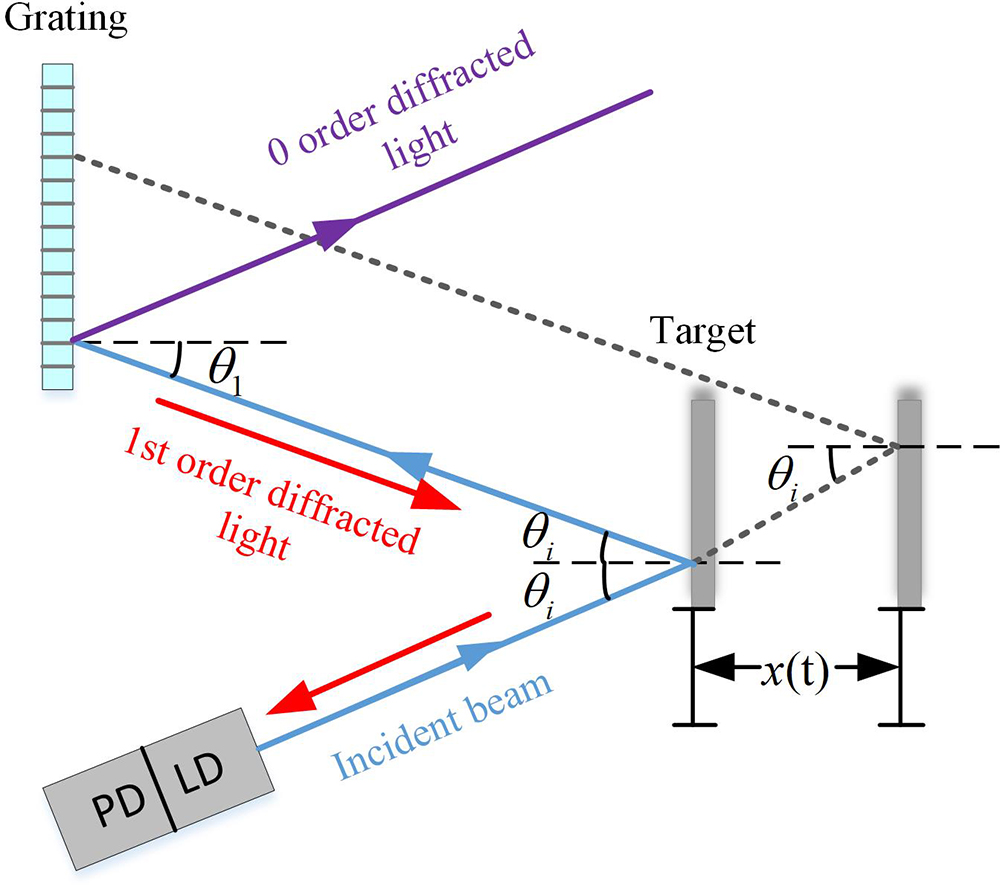
Figure 1 is the schematic diagram of the proposed interferometer, which is composed of a laser diode (LD), a reflective holographic grating, and a photodetector (PD). As we all know, the ruled grating will produce ghosting and a relatively large amount of diffracted light, which will have a negative impact on the measurement accuracy, while holographic gratings can reduce or even eliminate these errors[
![]()
Figure 1.Schematic diagram of SMGI.
The Littrow structure means that the th diffracted light returns along the optical path of the light incident on the grating, that is to say
Substituting Eq. (4) into Eq. (3), we can obtain the Littrow condition of the reflection grating diffraction as
In our proposed interferometer, the st diffracted beam is reflected back to the laser cavity to form SMI, as shown in Fig. 1, so
The light emitted by the laser is incident on the vibrating object at a fixed angle . Then, the reflected light from the vibrating object is incident on the grating at the same angle . The st diffracted beam returns to the laser cavity along the same path of the incident light. When the object moves in the horizontal direction, as shown in Fig. 1, the light incident on the grating scans the grating and then produces the SMI effect. Thus, the st diffracted light exhibits a phase change, which is caused by the grating Doppler effect and the optical path difference in motion. It can avoid the zero-order diffracted beam feedback, thereby improving the SNR[
According to the Doppler effect, when the grating moves at a speed , the frequency of the diffracted light changes accordingly[
![]()
Figure 2.Grating diffraction principle diagram.
The corresponding frequencies of the st diffracted beam are
The higher-order items are ignored to obtain
The Littrow structure indicates that the st diffraction angle is equal to the incident angle of the light, that is, . Therefore, Eq. (10) can be written as
Then, the Doppler shift of the st diffracted light can be written as
We can obtain the phase change of the st diffracted beam caused by the displacement due to the grating Doppler effect, as follows:
Meanwhile, the phase change caused by optical path length variation is
From Eq. (5), we can get
According to Eqs. (14) and (17), the total phase change of the proposed interferometer can be expressed as
Equation (18) indicates that the laser wavelength has no direct influence on the phase change of the proposed interferometer. Thus, it can withstand more environmental interference and reduce the measurement error caused by wavelength fluctuation.
is obtained by the integral reconstruction method[
![]()
Figure 3.Flow chart of integral reconstruction algorithm.
According to Eq. (18), we can obtain the displacement signal as follows:
3. Simulation Results
To verify the availability of the proposed interferometer in a weak feedback regime, simulation experiments are carried out, and the simulation results are shown in Fig. 4. The simulation parameters in Fig. 4 are set as follows. The peak-to-peak amplitude is 1 µm with harmonic vibration, and the vibration frequency is 5 Hz. The sampling frequency is 50 kHz, and the sampling number is 50,000. The wavelength of the LD, which works under weak feedback with , is 650 nm, and the line-width enhancement factor is 4.6. The pitch of the diffraction grating is 1/1200 mm.
![]()
Figure 4.Simulation harmonic vibration signals (C
Figure 4(a) represents the interference signals. Figure 4(b) displays the phase of the measured signals obtained by the integral reconstruction method. Figure 4(c) shows the simulated displacement in red and the reconstruction displacement in blue. In Fig. 4(d), the fringes represent the errors between the reconstruction and simulated displacements. The figure shows that the maximum absolute errors are approximately 7.36 nm.
4. Experimental Setup and Results
We carried out a sequence of experimental tests to verify the effectiveness of this interferometer. As shown in Fig. 5, the experimental setup consists of a low-cost semiconductor LD (QL65D5SA, QSI) with a wavelength of 650 nm used as the light source, a PD that is packaged in the LD to detect the current variation, and a reflective holographic grating with the grating pitch of 1/1200 mm. The LD, which is driven by a constant current driver (LD1255R, Thorlabs), is fixed on the 360° adjustable rotating table with an accuracy of 0.1°. A piezoelectric transducer (PZT, P753.1CD, PI) is used as an external target, and it can reach a resolution of 0.05 nm under closed-loop control. The grating, which is fixed on a clamp holder, is placed facing and parallel to the PZT to ensure that the incident angle of the light emitted from the LD to the target is equal to the incident angle of the reflected light from the target to the grating. A transconductance amplifier is used to amplify the detected current and convert it into a voltage. Subsequently, the voltage signals can be obtained using the data acquisition card (USB-4431, NI) and then the data are processed on a personal computer (PC).
![]()
Figure 5.Experimental setup.
Subsequently, a sequence of experiments has been performed to verify the proposed interferometer, as described in the following section.
To put this interferometer to the test, the PZT is controlled to generate a sinusoidal motion. The parameters are set as follows. The peak-to-peak amplitude of the motion is 1 µm, and the vibration frequency is 5 Hz. The sampling rate of the acquisition card is 50 kHz. The experimental results are shown in Fig. 6. Figure 6(a) displays the SMGI signals. Figure 6(b) shows the filtered signals that can be acquired by processing the interference signals through a low-pass filter. In Fig. 6(c), the red and blue fringes indicate the theoretical displacement of the target and the reconstruction displacement, respectively. As shown in Fig. 6(d), the maximum absolute errors are approximately 37.48 nm.
![]()
Figure 6.Experimental results of sinusoidal vibration. (a) Interference signals. (b) Filtered interference signals. (c) Reconstruction displacement (blue) and theoretical target displacement (red). (d) Errors.
Next, to verify the reliability of the proposed interferometer under the same condition, the PZT moves in a sinusoidal motion with a peak-to-peak amplitude of 2 µm. The frequency is from 2 Hz to 5 Hz, and the step size is 1 Hz. The sampling frequency is 50 kHz, and the sampling number is 50,000. Each experiment is carried out five times, and the errors are shown in Table 2. It manifests that the maximum absolute errors are not more than 50.00 nm.
| Peak-to-Peak Amplitude (µm) | Frequency (Hz) | Maximum Absolute Error (nm) | Average Absolute Error (nm) |
|---|---|---|---|
| 2 | 2 | 46.47 | 13.04 |
| 3 | 44.27 | 12.45 | |
| 4 | 46.65 | 15.69 | |
| 5 | 46.91 | 14.09 |
Table 2. Errors of Sinusoidal Vibration
Finally, to illustrate that our proposed interferometer can reconstruct the displacement of random vibrations accurately, the smooth random signals were selected for experimentation. The results are shown in Fig. 7. Figure 7(a) reveals the interference signals. The signals after the low-pass filter are shown in Fig. 7(b). The reconstructed displacement is represented by the blue curve, and the theoretical displacement of the target is denoted by the red curve, as shown in Fig. 7(c). Figure 7(d) demonstrates that the maximum absolute errors are approximately 49.89 nm.
![]()
Figure 7.Experimental results of random vibration. (a) Interference signals. (b) Filtered interference signals. (c) Reconstruction displacement (blue) and theoretical target displacement (red). (d) Errors.
From Eq. (19), the theoretical measurement errors of the proposed SMGI can be expressed as
Evidently, the measurement accuracy of the interferometer is affected by the errors of the phase , the grating pitch , and the incident angle . First, the accuracy of the extracted phase may be affected by the temperature of the environment, mechanical vibration, and electromagnetic interference. Among them, temperature has a non-negligible influence on the measurement, and the temperature controller can be used to reduce the influence on the extracting phase. Similarly, mechanical vibration has an important influence on the experiment. All optical equipment should be fixed on an optical isolation platform to reduce the influence of mechanical vibration on the experiment. Then, the optical equipment used in the experiment was grounded to reduce the influence of electromagnetic interference on the experiment. Second, the error of the grating pitch may be caused by grating inhomogeneity and environmental corrosion, which we can reduce by using an environmental controller or a protective cover. Eventually, by using a rotating table with an accuracy of 0.1°, the deviation of the incident angle can be controlled.
5. Conclusion
In conclusion, we propose an improved SMGI by combining the SMI and GI. The grating does not need to be attached to the vibrating target and can be integrated inside the interferometer to reduce the impact on the vibration parameters of the vibrating target and thereby reducing the measurement errors; it is also more convenient in practical application. A sequence of experiments is conducted on harmonic and random vibration of the target, and the maximum absolute errors are less than 50 nm. The simulation analysis and experimental results show that the proposed interferometer has good performance in micro displacement measurement. This interferometer provides a beneficial exploration for displacement measurement.
References
[1] Z. Duan, Y. Yu, B. Gao, C. Jiang. Absolute distance measurement based on multiple self-mixing interferometry. Opt. Commun., 389, 270(2017).
[2] C. Jiang, C. Li, Y. Wang. Improved transition detection algorithm for a self-mixing displacement sensor. Optik, 127, 5603(2016).
[3] Z. Zhang, C. Li, Z. Huang. Vibration measurement based on multiple Hilbert transform for self-mixing interferometry. Opt. Commun., 436, 192(2019).
[4] H. Zhen. Equivalent wavelength self-mixing interferometry for displacement measurement. Appl. Opt., 55, 7120(2016).
[5] S. Amin, U. Zabit, O. D. Bernal, T. Hussain. High resolution laser self-mixing displacement sensor under large variation in optical feedback and speckle. IEEE Sens. J., 20, 9140(2020).
[6] Y. Zhao, H. W. Zhang. Displacement measurement method based on laser self-mixing interference in the presence of speckle. Chin. Opt. Lett., 18, 051201(2020).
[7] M. Usman, U. Zabit, O. D. Bernal, G. Raja. Blind identification of occurrence of multi-modality in laser-feedback-based self-mixing sensor. Chin. Opt. Lett., 18, 011201(2020).
[8] T. Dong, B. Gao, Q. Chen, Y. Geng. Rotation velocity measurement based on self-mixing grating interferometer. Appl. Opt., 59, 5930(2020).
[9] A. Magnani, D. Melchionni, A. Pesatori, M. Norgia. Self-mixing digital closed-loop vibrometer for high accuracy vibration measurements. Opt. Commun., 365, 133(2016).
[10] A. Arasanz, F. J. Azcona, S. Royo, A. Jha, J. Pladellorens. A new method for the acquisition of arterial pulse wave using self-mixing interferometry. Opt. Laser Technol., 63, 98(2014).
[11] I. Milesi, M. Norgia, P. P. Pompilio, C. Svelto, R. L. Dellaca. Measurement of local chest wall displacement by a custom self-mixing laser interferometer. IEEE Trans. Instrum. Meas., 60, 2894(2011).
[12] S. Donati, M. T. Fathi. Transition from short-to-long cavity and from self-mixing to chaos in a delayed optical feedback laser. IEEE J. Quantum Electron., 48, 1352(2012).
[13] B. P. Abbottet?al.. GW151226: observation of gravitational waves from a 22-solar-mass binary black hole coalescence. Phys. Rev. Lett., 116, 241103(2016).
[14] Q. Chen, D. Lin, J. Wu, J. Yan, C. Yin. Straightness/coaxiality measurement system with transverse Zeeman dual-frequency laser. Meas. Sci. Technol., 16, 2030(2005).
[15] C. F. Kao, S. H. Lu, H. M. Shen, K. C. Fan. Diffractive laser encoder with a grating in Littrow configuration. Jpn. J. Appl. Phys., 47, 1833(2008).
[16] J. Y. Lee, H. Y. Chen, C. C. Hsu, C. C. Wu. Optical heterodyne grating interferometry for displacement measurement with subnanometric resolution. Sens. Actuators A Phys., 137, 185(2007).
[17] T. Suzuki, R. Hioki. Translation of light frequency by a moving grating. J. Opt. Soc. Am., 57, 1551(1967).
[18] C. C. Wu, C. C. Hsu, J. Y. Lee, Y. Z. Chen. Heterodyne common-path grating interferometer with Littrow configuration. Opt. Express, 21, 13322(2013).
[19] J. Zhang, K. Iwata, A. Shibuya, H. Kikuta, C. S. Park. Method for calibrating system parameters of a multidirectional interferometers system. Appl. Opt., 45, 605(2006).
[20] D. Guo, M. Wang. Note: design of a laser feedback interferometer with double diffraction system. Rev. Sci. Instrum., 86, 083111(2015).
[21] D. Guo, M. Wang, H. Hao. Self-mixing grating interferometer: theoretical analysis and experimental observations. Interferometry XVIII(2016).
[22] D. Guo, L. Shi, Y. Yu, W. Xia, M. Wang. Micro-displacement reconstruction using a laser self-mixing grating interferometer with multiple-diffraction. Opt. Express, 25, 31394(2017).
[23] T. Bosch, N. Servagent, S. Donati. Optical feedback interferometry for sensing application. Opt. Eng., 40, 20(2001).
[24] Y. Fan, B. Liu, Y. Yu, J. Xi, Q. Guo, J. Tong. Analysis on the transient of a self-mixing interferometry sensing system. Tencon 2015–2015 IEEE Region 10 Conference(2015).
[25] C. Palmer. Diffraction Grating Handbook(2005).
[26] F. Cheng, K. C. Fan. Linear diffraction grating interferometer with high alignment tolerance and high accuracy. Appl. Opt., 50, 4550(2011).
[27] X. Wang, Y. Yuan, S. Luqing, B. Gao, P. Chen. Self-mixing interference displacement measurement under very weak feedback regime based on integral reconstruction method. Opt. Commun., 445, 236(2019).

Set citation alerts for the article
Please enter your email address
© Copyright 2018-2021 | Chinese Laser Press. All Rights Reserved 沪ICP备15018463号-20