• Laser & Optoelectronics Progress
  • Vol. 56, Issue 13, 131103 (2019)
Yang Liu, Runqiang Jiang*, Hongjun Yu, and Jian Chen
Author Affiliations
  • Changchun Institute of Optics, Fine Mechanics and Physics, Chinese Academy of Sciences, Changchun, Jilin 130033, China
  • show less
    DOI: 10.3788/LOP56.131103 Cite this Article Set citation alerts
    Yang Liu, Runqiang Jiang, Hongjun Yu, Jian Chen. Subjective Image Quality Assessment for Large Samples[J]. Laser & Optoelectronics Progress, 2019, 56(13): 131103 Copy Citation Text show less
    Screenshot of software used in subjective assessment experiments of TID2013
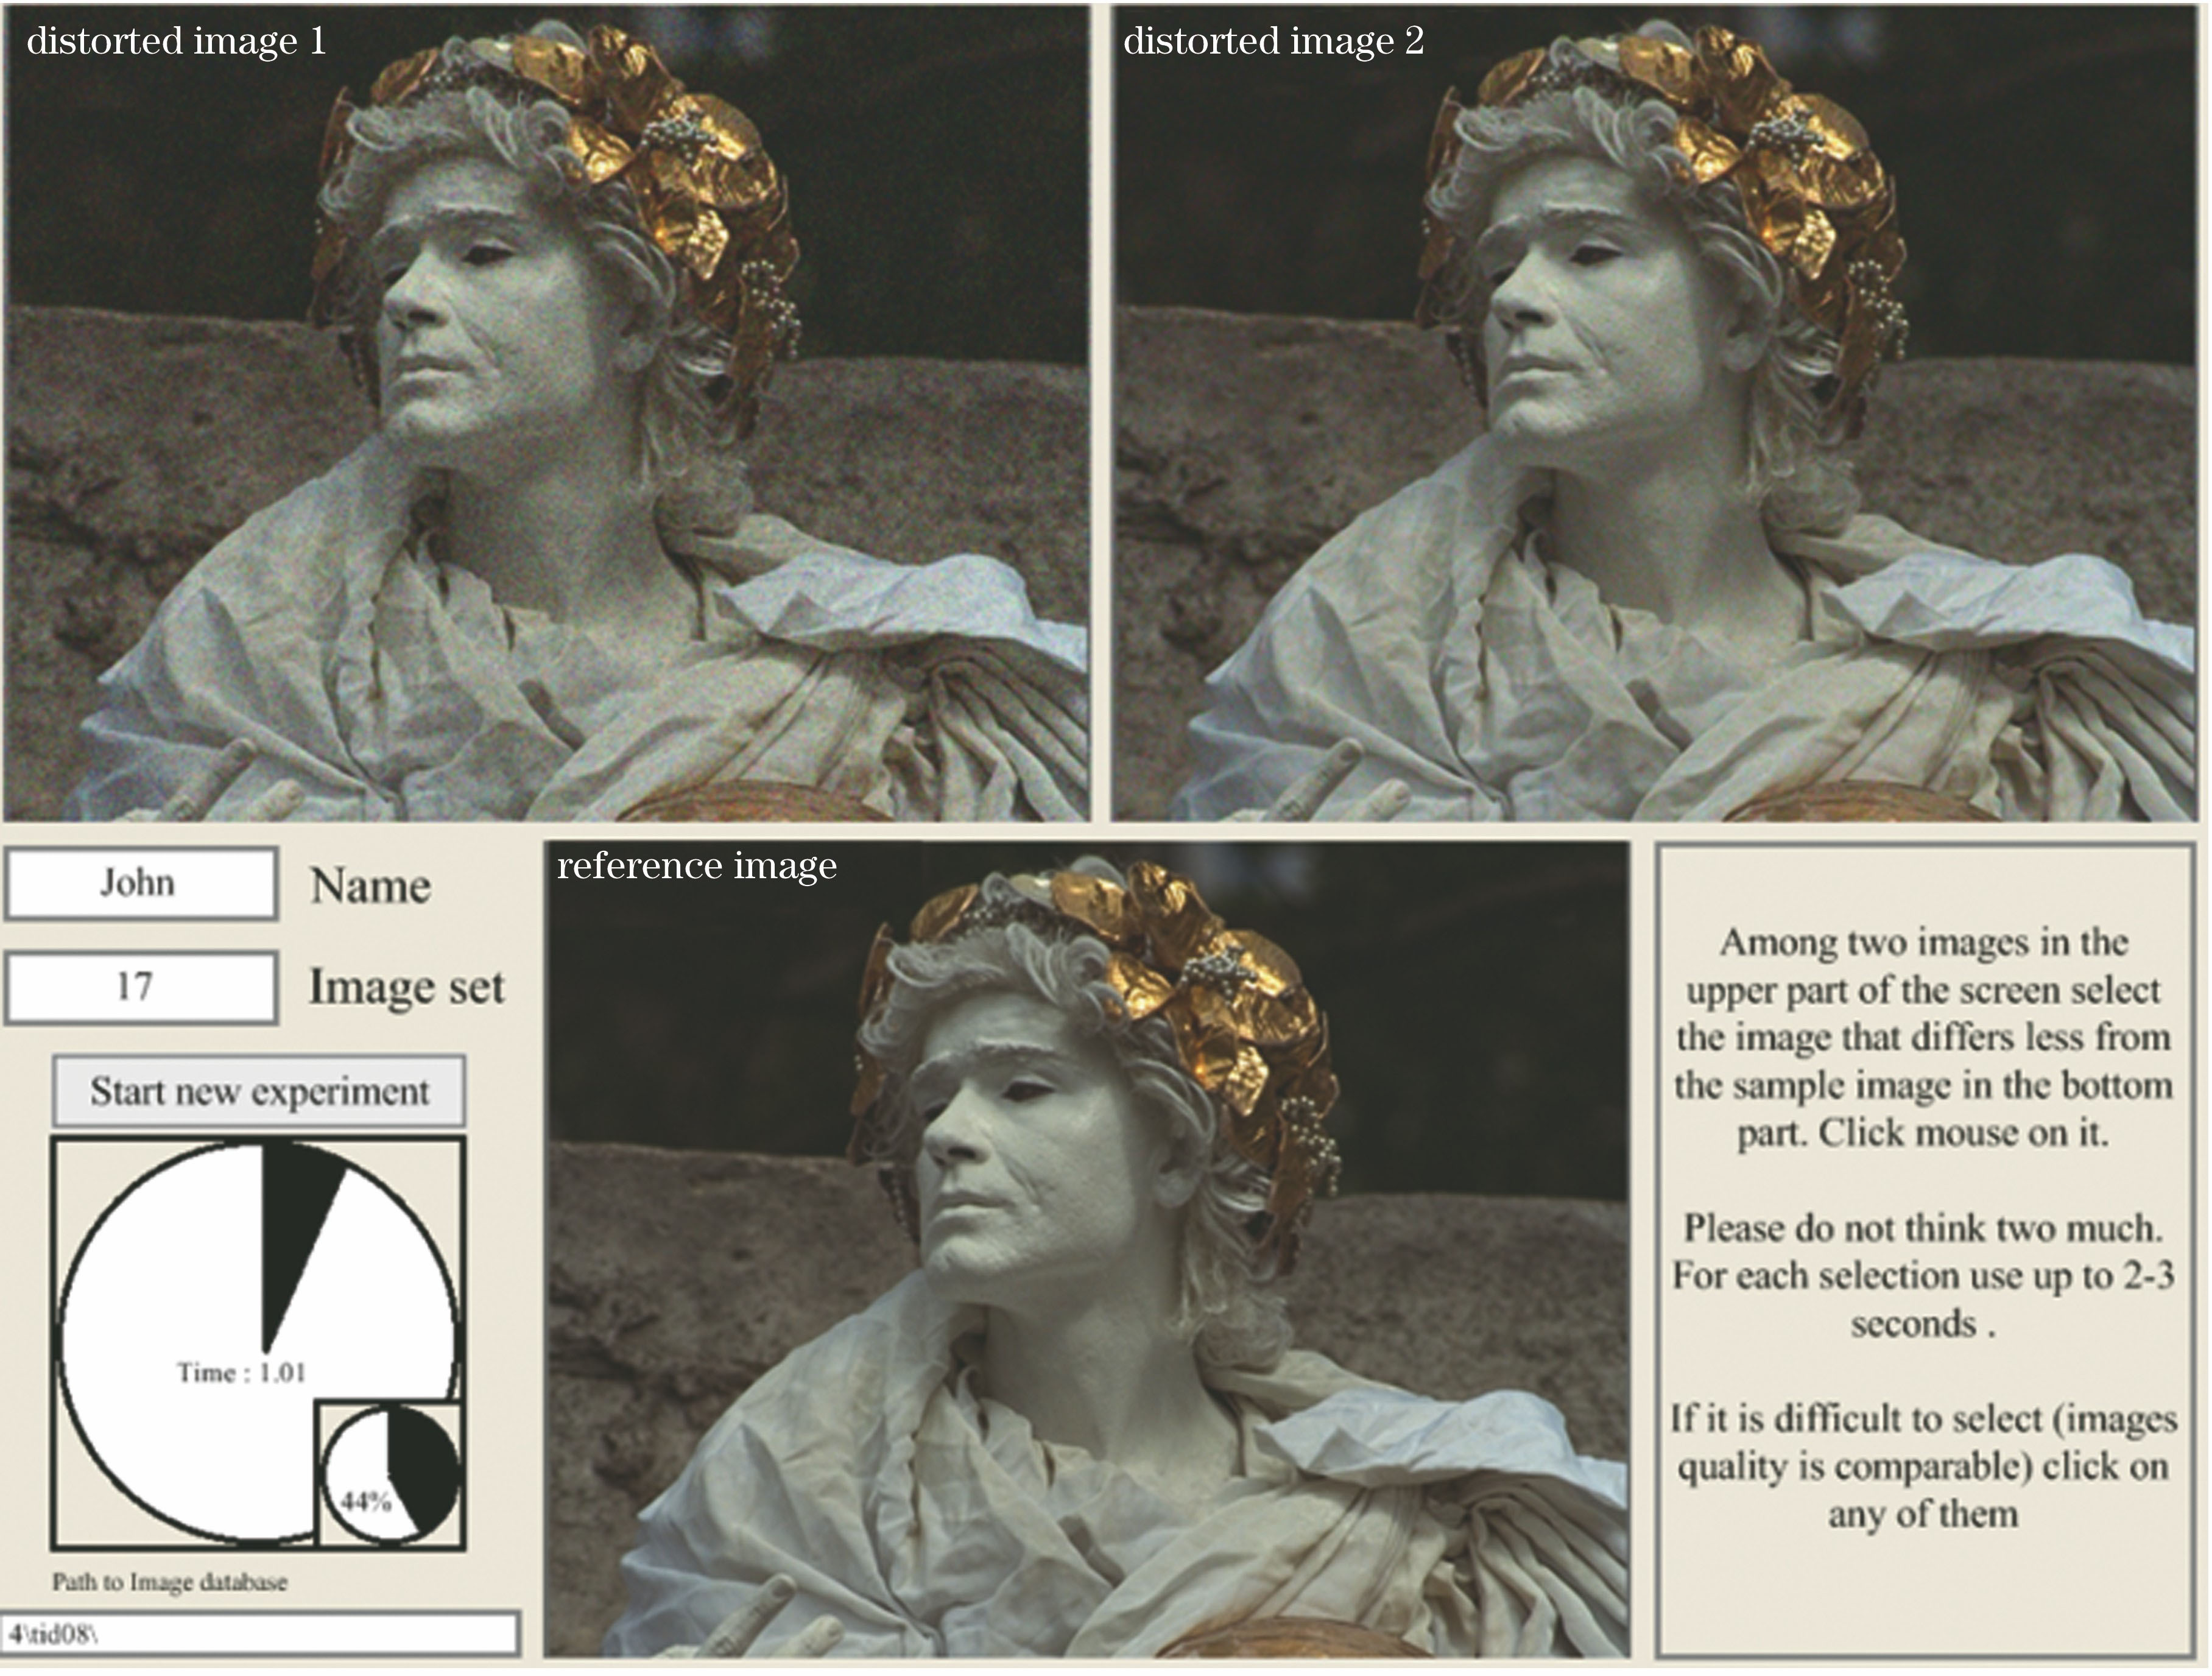
    Fig. 1. Screenshot of software used in subjective assessment experiments of TID2013
    Effects of r1 and r2 on results of subjective assessment
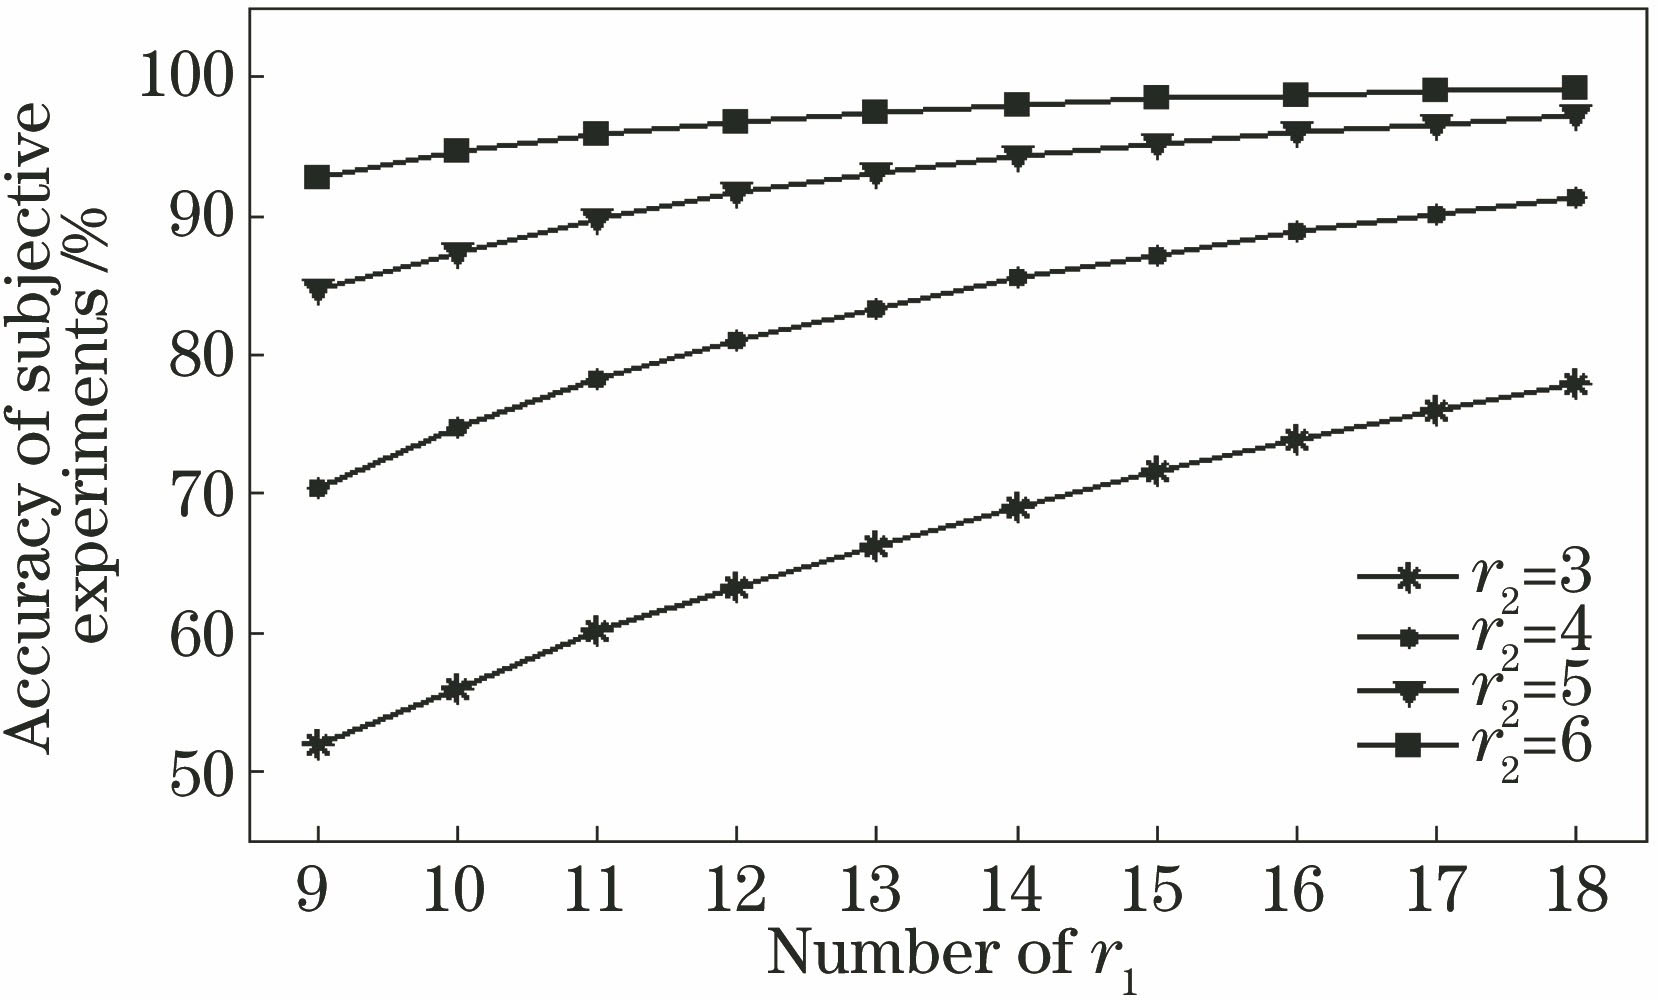
    Fig. 2. Effects of r1 and r2 on results of subjective assessment
    Screenshot of software used in cyclical integrating
    Fig. 3. Screenshot of software used in cyclical integrating
    Screenshot of software used in selecting best quality
    Fig. 4. Screenshot of software used in selecting best quality
    Screenshot of software used in adjusting sequence
    Fig. 5. Screenshot of software used in adjusting sequence
    Reference image
    Fig. 6. Reference image
    Results of subjective assessment experiments
    Fig. 7. Results of subjective assessment experiments
    Dynamic clustering diagram of images
    Fig. 8. Dynamic clustering diagram of images
    Subjective assessment scores of image quality
    Fig. 9. Subjective assessment scores of image quality
    Screenshot of software used in test of just-noticeable difference
    Fig. 10. Screenshot of software used in test of just-noticeable difference
    Areas that are easily perceived to change in quality
    Fig. 11. Areas that are easily perceived to change in quality
    Euclidean distances between test results and true values
    Fig. 12. Euclidean distances between test results and true values
    STDs of results obtained by proposed method
    Fig. 13. STDs of results obtained by proposed method
    Comparison of STDs between proposed method and other image quality databases
    Fig. 14. Comparison of STDs between proposed method and other image quality databases
    DatabaseYearReferenceDistortionLevelTotalFormatResolution
    LIVE(image)200629551011BMP≤768×512
    IVC200510104195BMP512×512
    CSIQ20103064-5930PNG512×512
    TID20082008251741725BMP512×384
    TID20132013252453025BMP512×384
    Table 1. Widely used image quality databases
    DatabaseMethodScoreSubjectRatingScreenDistance
    LIVE(image)SSDMOS16120-29CRT/21″2Hs-2.5Hs
    IVCDSISDMOS1515CRT/21″6Hs
    CSIQSSDMOS255-7LCD/21″80 cm
    TID2008DSCQSMOS83833LCD/19″2Hs-4Hs
    TID2013DSCQSMOS98547LCD&CRT/19″2Hs-4Hs
    Table 2. Experiments of subjective assessment
    ScoreDistortion levelScoreDistortion level
    -3Much worse+1Slightly better
    -2Worse+2Better
    -1Slightly worse+3Much better
    0The same
    Table 3. Quality scale of subjective assessment for ITU-R BT.500-13
    ScoreDistortion level
    +2Better
    +1The same
    Table 4. Simplified quality scale of subjective assessment
    Distortion level135172432404856
    Point spread blur radius0.310.941.565.317.5010.0012.5015.0017.50
    Just noticeable difference+0.33+0.28+0.34+0.51+0.66+0.97+1.52+1.93+3.35
    Obvious difference+0.69+0.75+0.84+1.86+2.05+2.66+2.84+3.67+3.96
    Table 5. Mean JND
    Yang Liu, Runqiang Jiang, Hongjun Yu, Jian Chen. Subjective Image Quality Assessment for Large Samples[J]. Laser & Optoelectronics Progress, 2019, 56(13): 131103
    Download Citation