
Yanmin Li, Shuangbao Shu, Zhiwen Li, Zhiqiang Chen, Jingjing Chen. Atmospheric Correction and Image Quality Assessment of WFV Camera in GaoFen-1 Satellite[J]. Acta Optica Sinica, 2020, 40(20): 2001004
- Acta Optica Sinica
- Vol. 40, Issue 20, 2001004 (2020)
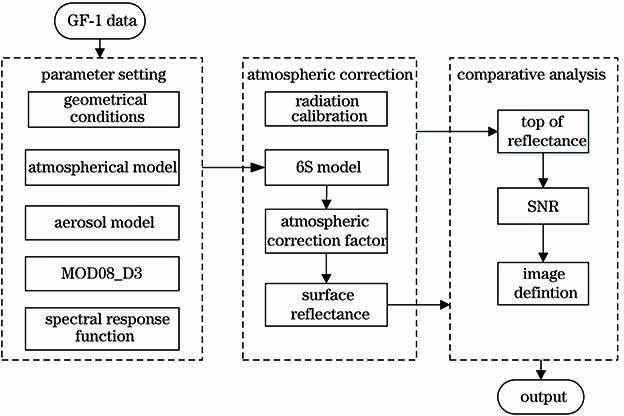
Fig. 1. Flow chart of algorithm
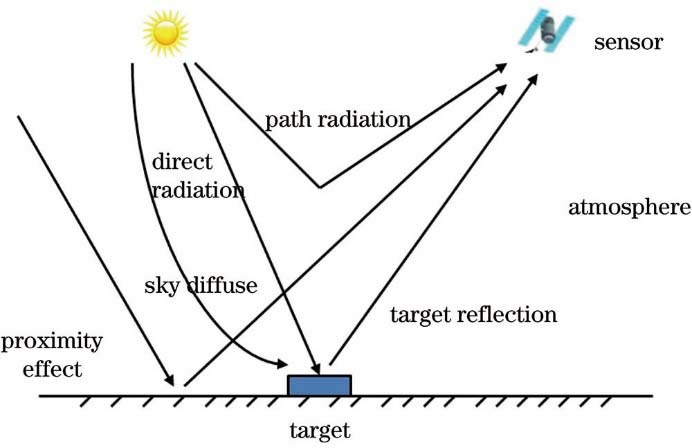
Fig. 2. Interaction between solar radiation and atmosphere
Fig. 3. Spectral response function of GF-1 WFV3
Fig. 4. Daily average data of atmospheric AOD from MODIS
Fig. 5. Images before and after atmospheric correction. (a) Before correction; (b) after correction
Fig. 6. Comparison of typical features spectral curves. (a) Water; (b) vegetation; (c) building; (d) land
Fig. 7. Typical region before correction. (a) Region Ⅰ; (b) region Ⅱ; (c) region Ⅲ
Fig. 8. Typical region after correction. (a) Region Ⅰ; (b) region Ⅱ; (c) region Ⅲ
Fig. 9. Selection of uniform image blocks before correction
Fig. 10. Selection of uniform image blocks after correction
Fig. 11. SNR of Chaohu. (a) Band1; (b) Band2; (c) Band3; (d) Band4
|
Table 1. Mean solar radiation values of GF-1 satellite sensors unit: W·m-2
| |||||||||||||||||||||||||||||
Table 2. Region Ⅰ definition
| |||||||||||||||||||||||||||||
Table 3. Region Ⅱ definition
| |||||||||||||||||||||||||||||
Table 4. Region Ⅲ definition

Set citation alerts for the article
Please enter your email address
© Copyright 2018-2021 | Chinese Laser Press. All Rights Reserved 沪ICP备15018463号-20