- Spectroscopy and Spectral Analysis
- Vol. 42, Issue 9, 2788 (2022)
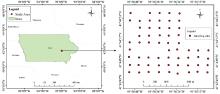
Fig. 1. The geographical location of study area and the distribution of soil samples
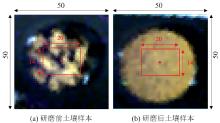
Fig. 2. RGB images of the single soil sample before and after grinding
R: 638 nm, G: 550 nm, B: 470 nm
R: 638 nm, G: 550 nm, B: 470 nm
Fig. 3. The mean reflectances of imaging spectra (d , b ) and non-imaging spectra (c , a ) of the soil samples before and after grinding
Fig. 4. The correlation coefficient between imaging spectra (d , b )/non-imaging spectra (c , a ) and SOC for the soil samples before and after grinding
Fig. 5. The VIP of imaging spectra (d , b )/non-imaging spectra (c , a ) of the soil samples before and after grinding
| ||||||||||||||||||||||||||||||||||||||||||||
Table 1. The statistical description of SOC content
| ||||||||||||||||||||||||||||||||||||||||||||||||||||||||||||||||||||||||||||||||||||||||||||||||||||||||||||||||||||||||||||||||||||||||||||||||||||||||||||||||||||||||||||||||||||||||||||||||||||||||||||||||||||||||||||||||||||||||||||||||||||||||||||||||||||||||||||||||||||||||||||||||||||||||||||||||||||||||||||||||||||||||||||||||||||||||||||||||||||||||||||||||||||||||||||||||||||||||||||||||||||||||||||||||||||||||||||||||||||||||||||||
Table 2. PLSR and SVR model performances based on imaging spectra/non-imaging spectra of the soil samples before and after grinding

Download Citation

Set citation alerts for the article
Please enter your email address
© Copyright 2018-2021 | Chinese Laser Press. All Rights Reserved 沪ICP备15018463号-20