
Huang Xiaotong, Li Lijuan, Lin Xuezhu, Guo Lili, Xiong Weihua. High-Precision Measurement and Path Planning for Butt Joint of Large Parts[J]. Chinese Journal of Lasers, 2020, 47(12): 1204008
- Chinese Journal of Lasers
- Vol. 47, Issue 12, 1204008 (2020)
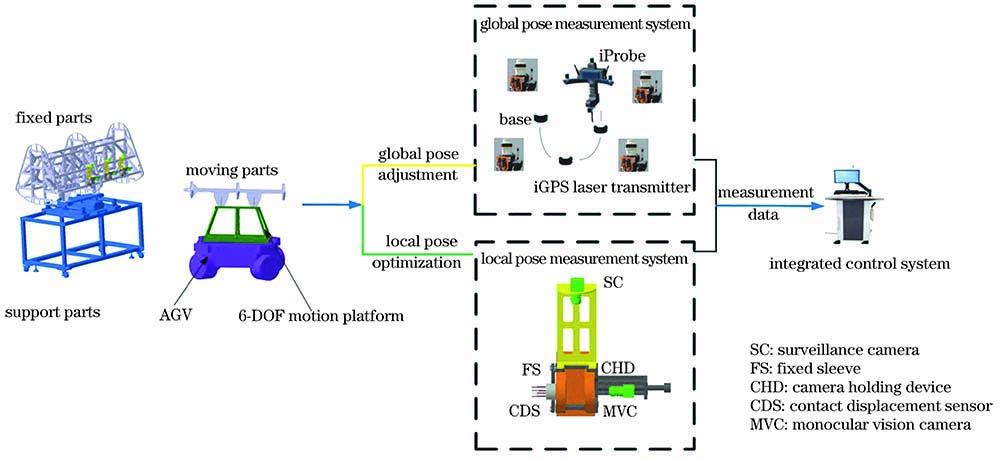
Fig. 1. Digital automatic docking measurement system
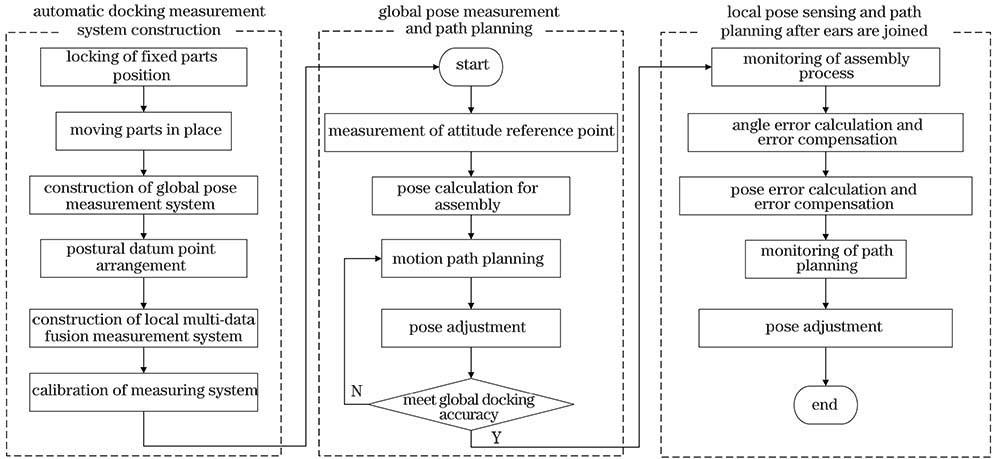
Fig. 2. Flowchart of high-precision measurement and path planning for docking of large components
Fig. 3. Measurement feature points
Fig. 4. Schematic of deviation. (a) Non-parallel axes; (b) parallel and not coaxial (c) neither parallel nor coaxial
Fig. 5. Angle error measurement of joint ears. (a) Angle error measuring device; (b) schematic of angle error
Fig. 6. Position error measurement of joint ears. (a) Measuring device; (b) schematic of position error
Fig. 7. Monitoring camera holding device
Fig. 8. Angle error solution model. (a) One angle error; (b) two angle errors
Fig. 9. iGPS transmitter layout
Fig. 10. Analysis of docking deviation in different situations. (a) Global docking; (b) after partial error compensation
| |||||||||||||||||||||||||||||||||||||||||||||||||||||||
Table 1. Coordinate information of reference point of attitude adjustment
|
Table 2. Angle measurements before and after compensation
|
Table 3. Position error before and after compensation

Set citation alerts for the article
Please enter your email address
© Copyright 2018-2021 | Chinese Laser Press. All Rights Reserved 沪ICP备15018463号-20