• Acta Optica Sinica
  • Vol. 43, Issue 5, 0506001 (2023)
Ming Wang1, Zhou Sha1, Hao Feng1、*, Lipu Du2, and Dunzhe Qi2
Author Affiliations
  • 1State Key Laboratory of Precision Measuring Technology and Instruments, School of Precision Instrument and Opto-Electronics Engineering, Tianjin University, Tianjin 300072, China
  • 2Ningxia Hui Autonomous Region Water Conservancy Engineering Construction Center, Yinchuan 750004, Ningxia , China
  • show less
    DOI: 10.3788/AOS221468 Cite this Article Set citation alerts
    Ming Wang, Zhou Sha, Hao Feng, Lipu Du, Dunzhe Qi. φ-OTDR Pattern Recognition Based on LSTM-CNN[J]. Acta Optica Sinica, 2023, 43(5): 0506001 Copy Citation Text show less
    Structure diagram of φ-OTDR
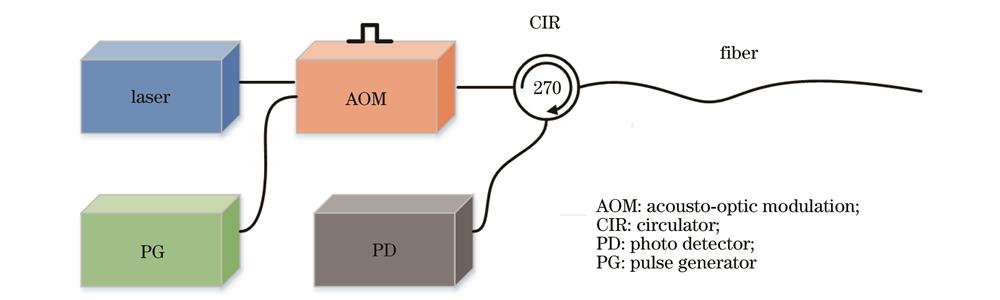
    Fig. 1. Structure diagram of φ-OTDR
    Comparison of the data presentation form between the time-space map and the time-domain curve
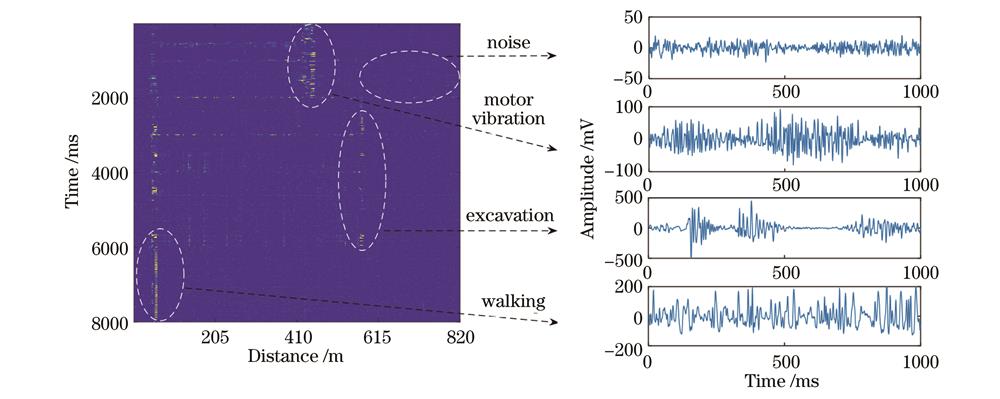
    Fig. 2. Comparison of the data presentation form between the time-space map and the time-domain curve
    Operation process of CNN and LSTM. (a) 1D convolution; (b) 2D convolution; (c) LSTM
    Fig. 3. Operation process of CNN and LSTM. (a) 1D convolution; (b) 2D convolution; (c) LSTM
    Schematic of the internal structure of φ-OTDR integrated system
    Fig. 4. Schematic of the internal structure of φ-OTDR integrated system
    Structure diagram of BRNN (LSTM)
    Fig. 5. Structure diagram of BRNN (LSTM)
    Training situation and test results of LSTM. (a) Curve of loss function with dynamic learning rate; (b) curve of loss function with fixed learning rate; (c) background noise; (d) excavation signal; (e) motor vibration signal; (f) walking signal
    Fig. 6. Training situation and test results of LSTM. (a) Curve of loss function with dynamic learning rate; (b) curve of loss function with fixed learning rate; (c) background noise; (d) excavation signal; (e) motor vibration signal; (f) walking signal
    STFT results of target signals. (a) Background noise; (b) excavation signal; (c) motor vibration signal; (d) walking signal
    Fig. 7. STFT results of target signals. (a) Background noise; (b) excavation signal; (c) motor vibration signal; (d) walking signal
    Network structure of LSTM-CNN
    Fig. 8. Network structure of LSTM-CNN
    Comparison of overall evaluation indicators. (a) Train accuracy; (b) test accuracy; (c) train loss; (d) test loss
    Fig. 9. Comparison of overall evaluation indicators. (a) Train accuracy; (b) test accuracy; (c) train loss; (d) test loss
    Recall comparison of test set. (a) Background noise; (b) excavation signal; (c) motor vibration signal; (d) walking signal
    Fig. 10. Recall comparison of test set. (a) Background noise; (b) excavation signal; (c) motor vibration signal; (d) walking signal
    Precision comparison of test set. (a) Background noise; (b) excavation signal; (c) motor vibration signal; (d) walking signal
    Fig. 11. Precision comparison of test set. (a) Background noise; (b) excavation signal; (c) motor vibration signal; (d) walking signal
    Precision of validation sample. (a) Background noise; (b) excavation signal; (c) motor vibration signal; (d) walking signal
    Fig. 12. Precision of validation sample. (a) Background noise; (b) excavation signal; (c) motor vibration signal; (d) walking signal
    Recall of validation sample. (a) Background noise; (b) excavation signal; (c) motor vibration signal; (d) walking signal
    Fig. 13. Recall of validation sample. (a) Background noise; (b) excavation signal; (c) motor vibration signal; (d) walking signal
    Precision of validation sample of models in Table 3. (a) Background noise; (b) excavation signal; (c) motor vibration signal;(d) walking signal
    Fig. 14. Precision of validation sample of models in Table 3. (a) Background noise; (b) excavation signal; (c) motor vibration signal;(d) walking signal
    Recall of validation sample of models in Table 3. (a) Background noise; (b) excavation signal; (c) motor vibration signal; (d) walking signal
    Fig. 15. Recall of validation sample of models in Table 3. (a) Background noise; (b) excavation signal; (c) motor vibration signal; (d) walking signal
    Net numberNet structureInputNumber of CNN layersLayer nodeLearning rate
    1ANNTime-domain sequence0360.01
    2ANNSTFT2800.05
    3ANNTime-domain sequence + STFT2880.03
    4CNNTime-domain sequence + STFT4900.001
    5LSTM-CNNTime-domain sequence + STFT4900.001
    Table 1. Important parameters of different neural network structures
    Sample typeNumber of sample points

    Accuracy /

    %

    NoiseExcavationMotor vibrationWalking
    Original327218478710
    Net 125216772046835.77
    Net 234018055066382.28
    Net 313614081537347.39
    Net 432819349369589.47
    Net 531522449369594.43
    Table 2. Distribution of identification results and accuracy of the verification samples
    Model typeModel 1Model 2Model 3Model 4Model 5
    StructureLSTM-CNNSVMKNNDecision-treeRandom-forest
    Test accuracy /%94.6083.6583.7178.1787.38
    Validation accuracy /%94.4381.9865.6675.2483.26
    Table 3. Comparison of LSTM-CNN and common machine-learning models
    Ming Wang, Zhou Sha, Hao Feng, Lipu Du, Dunzhe Qi. φ-OTDR Pattern Recognition Based on LSTM-CNN[J]. Acta Optica Sinica, 2023, 43(5): 0506001
    Download Citation