• Laser & Optoelectronics Progress
  • Vol. 56, Issue 23, 231201 (2019)
Xiaojun Cheng1、2、**, Xinxin Xiong1, Zexin Yang1、*, and Rongqi Yang3
Author Affiliations
  • 1College of Surveying and Geo-Informatics, Tongji University, Shanghai 200092, China
  • 2Key Laboratory of Advanced Engineering Surveying of Ministry of Natural Resources, Shanghai 200092, China
  • 3Shanghai Merchant Ship Design and Research Institute, Shanghai 201203, China
  • show less
    DOI: 10.3788/LOP56.231201 Cite this Article Set citation alerts
    Xiaojun Cheng, Xinxin Xiong, Zexin Yang, Rongqi Yang. Cavern Capacity Calculation Using Terrestrial Lidar[J]. Laser & Optoelectronics Progress, 2019, 56(23): 231201 Copy Citation Text show less
    Schematic of reconstructing convex hull by Graham scan algorithm. (a) Search for pole; (b) polar-angle based ordering; (c) elimination of internal points; (d)(e)(f) three sequential points form anticlockwise direction; (g) three sequential points form clockwise direction; (h) reconstructed convex hull
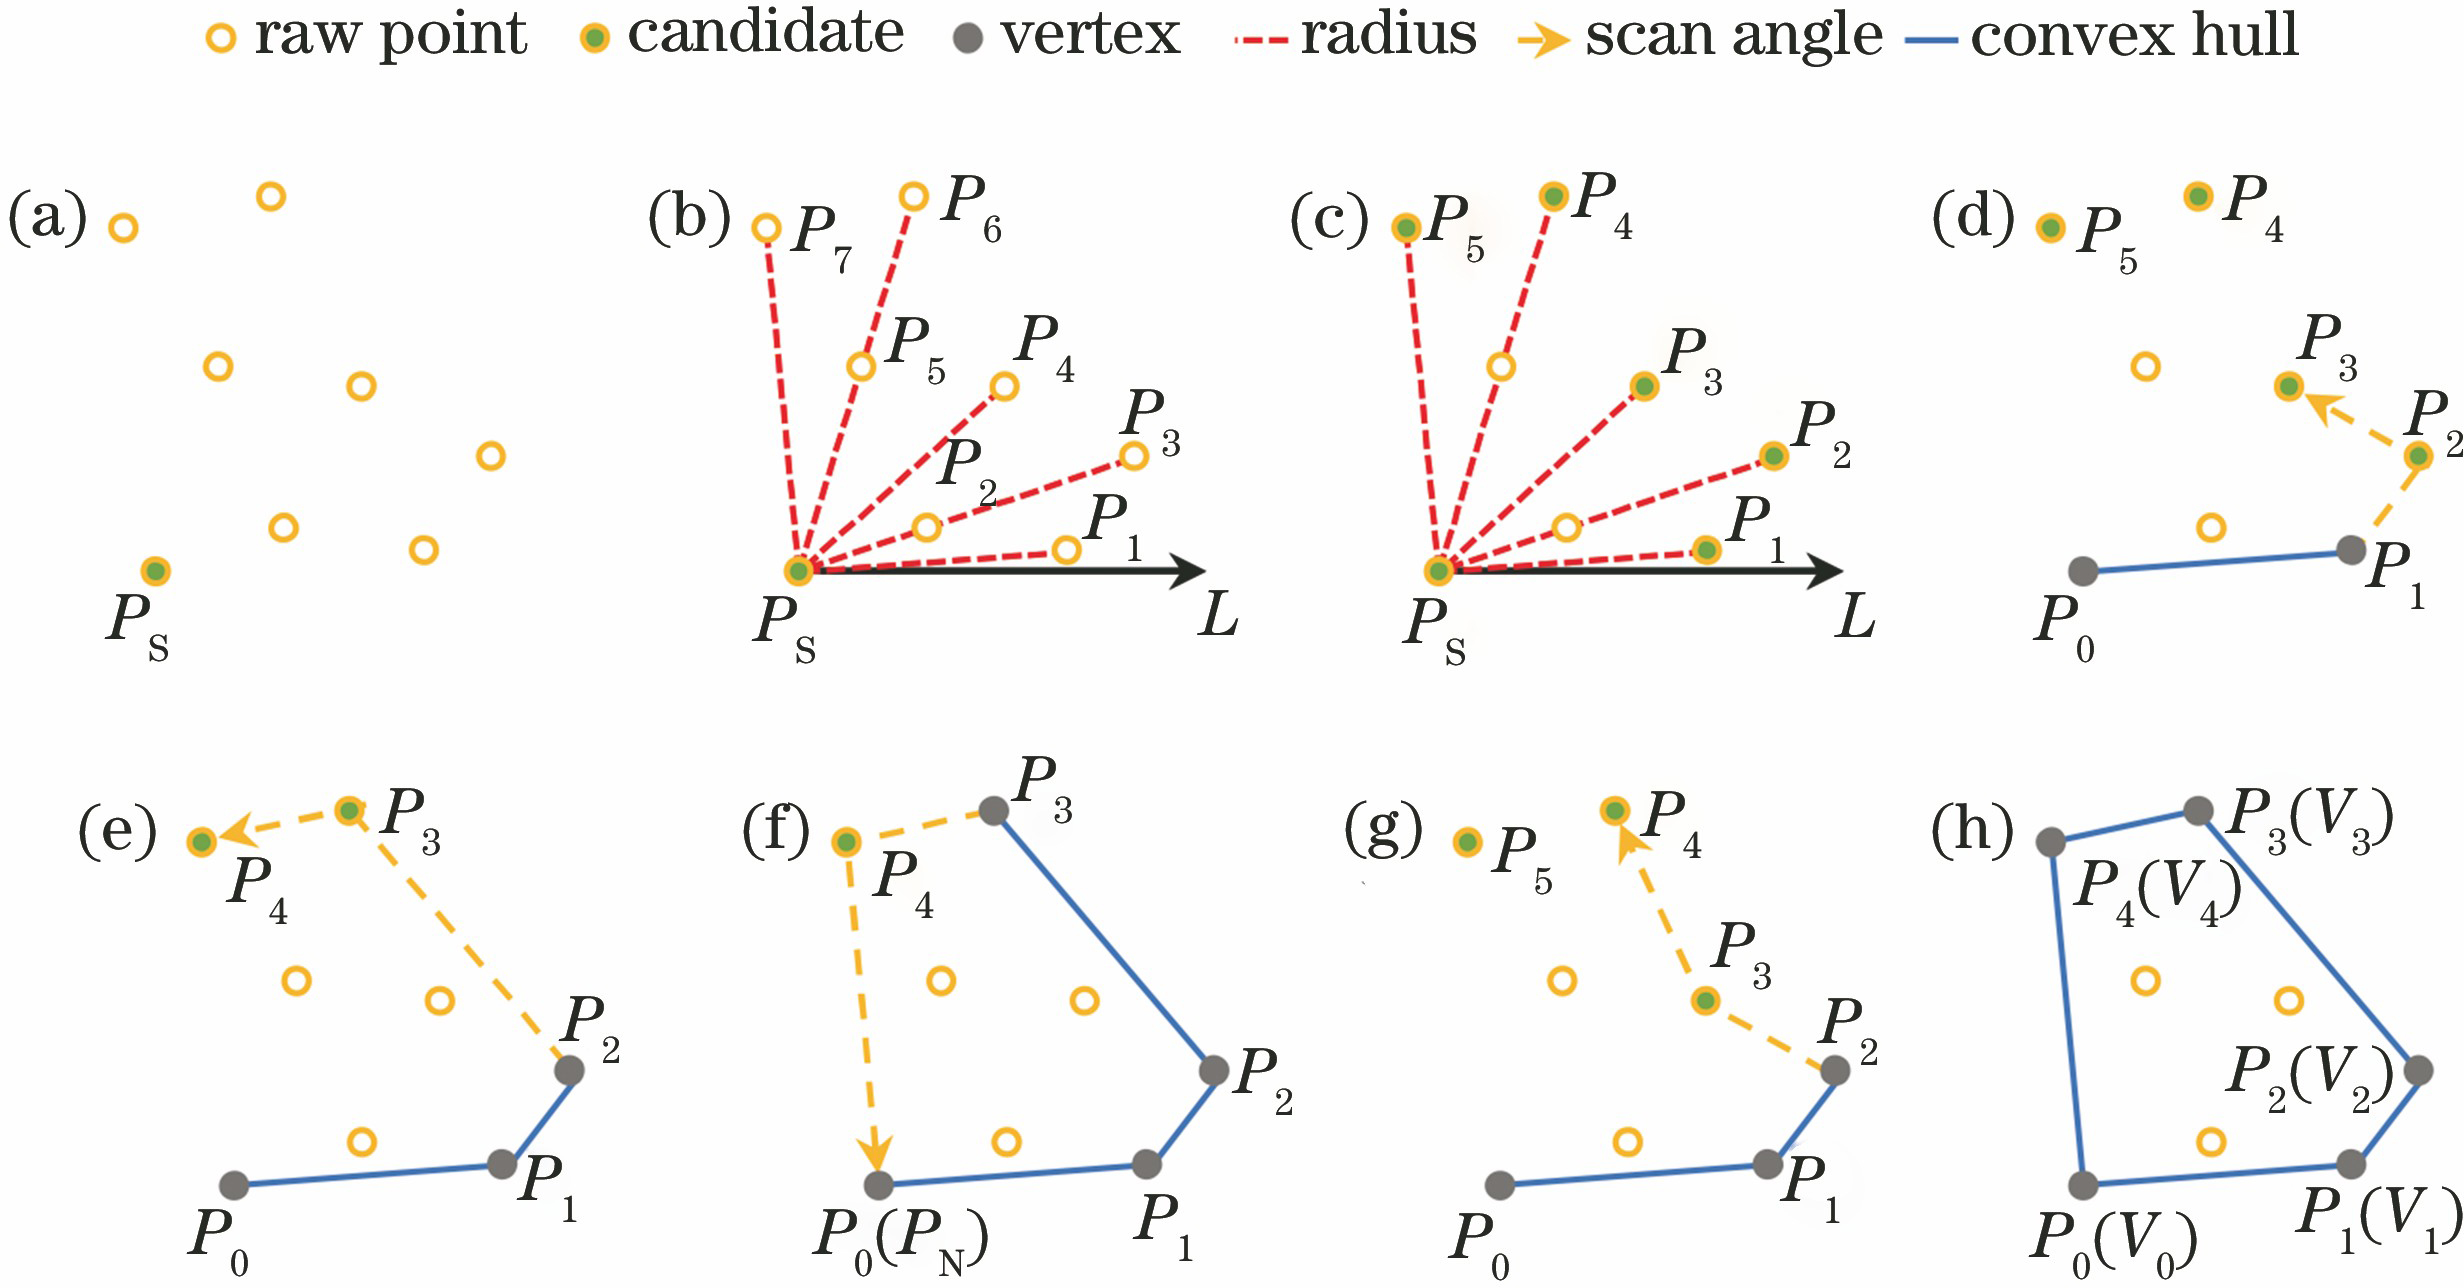
    Fig. 1. Schematic of reconstructing convex hull by Graham scan algorithm. (a) Search for pole; (b) polar-angle based ordering; (c) elimination of internal points; (d)(e)(f) three sequential points form anticlockwise direction; (g) three sequential points form clockwise direction; (h) reconstructed convex hull
    Distance from candidate point to edge of polygon. (a) ρ∈(-¥,0]; (b) ρ∈(0,1); (c) ρ∈[1,+¥)
    Fig. 2. Distance from candidate point to edge of polygon. (a) ρ∈(-,0]; (b) ρ∈(0,1); (c) ρ∈[1,+)
    Effect pictures of experimental data. (a) Size of cross section of cavern; (b) line-shaped point cloud fragment; (c)(d)(e) sizes of line-shaped, turning-shaped, and intersection-shaped point cloud fragments
    Fig. 3. Effect pictures of experimental data. (a) Size of cross section of cavern; (b) line-shaped point cloud fragment; (c)(d)(e) sizes of line-shaped, turning-shaped, and intersection-shaped point cloud fragments
    Experimental results of contour point extraction. (a) Schematic of hierarchical projection; (b) detailed image of contour points
    Fig. 4. Experimental results of contour point extraction. (a) Schematic of hierarchical projection; (b) detailed image of contour points
    Experimental results of section contour point ordering (data are down-sampled for better visualization). (a)(b)(c) Polar-angle based ordering method; (d)(e)(f) our method
    Fig. 5. Experimental results of section contour point ordering (data are down-sampled for better visualization). (a)(b)(c) Polar-angle based ordering method; (d)(e)(f) our method
    DataNumber of pointsAverage pointdensity /mm
    Line-shape981,837
    Turning-shape1,042,7968
    Intersection-shape1,836,865
    Table 1. Parameter information of experimental data
    StageParameterValue
    Point cloud slicinghU/cm4
    hL/cm10
    Contour point extractionε /mm1
    r/mm8
    Table 2. Experimental parameters
    DataNumberof pointsNumber of pointswith wrong order
    Polar-anglebased orderingOurs
    Line-shape1,34520
    Turning-shape1,1482130
    Intersection-shape2,6101,039
    Table 3. Comparison between polar-angle based ordering method and our method
    Height /mArea of cross sections /m2Relative error /%
    Ground truthTrigonometric methodOursTrigonometric methodOurs
    0.536.10536.10336.1050.0060
    1.036.20836.20436.2050.0110.008
    1.536.03036.04036.0350.0280.014
    2.035.46635.47235.4690.0170.008
    2.528.74628.75028.7490.0140.010
    Table 4. Area table of line-shaped data
    Height /mArea of cross sections /m2Relative error /%
    Ground truthTrigonometric methodOursTrigonometric methodOurs
    0.543.83943.95043.8460.2530.016
    1.043.87443.99443.8740.2740
    1.543.88143.91443.8670.0750.032
    2.043.06544.12743.0682.4660.007
    2.534.11435.11734.1092.9400.015
    Table 5. Area table of turning-shaped data
    Height /mArea of cross sections /m2Relative error /%
    Ground truthTrigonometric methodOursTrigonometric methodOurs
    0.567.06179.03967.07317.8610.018
    1.066.96679.05566.97518.0520.013
    1.566.79179.19666.78518.5730.009
    2.066.90279.04766.90618.1530.006
    2.553.92467.24953.92024.7110.007
    Table 6. Area table of intersection-shaped data
    Height /mLine-shaped dataTurning-shaped dataIntersection-shaped data
    Ours /m3Groundtruth /m3Relativeerror /%Ours /m3Groundtruth / m3Relativeerror /%Ours /m3Groundtruth /m3Relativeerror /%
    0.5018.01918.019021.87921.8780.00533.53233.5300.006
    0.7527.05527.0540.00432.84032.840050.28650.2840.004
    1.0036.10736.1050.00643.80443.8050.00267.03867.0350.004
    1.2545.14645.1440.00454.77154.7720.00283.77183.7660.006
    1.5054.16554.1630.00465.74265.7430.002100.482100.4770.005
    1.7563.16963.1660.00576.70576.7070.003117.169117.1630.005
    2.0072.12472.1220.00387.62587.6290.005133.958133.9530.004
    2.2580.72980.7280.00197.99297.9990.007150.186150.1840.001
    2.5088.48088.4800107.257107.2680.010164.773164.7730
    Table 7. Capacity table of three experimental data
    Xiaojun Cheng, Xinxin Xiong, Zexin Yang, Rongqi Yang. Cavern Capacity Calculation Using Terrestrial Lidar[J]. Laser & Optoelectronics Progress, 2019, 56(23): 231201
    Download Citation