• Journal of Geographical Sciences
  • Vol. 30, Issue 8, 1219 (2020)
Chi ZHANG1、*, Shaohong WU1, and Guoyong LENG2
Author Affiliations
  • 1Key Laboratory of Land Surface Pattern and Simulation, Institute of Geographic Sciences and Natural Resources Research, CAS, Beijing 100101, China
  • 2Key Laboratory of Water Cycle and Related Land Surface Processes, Institute of Geographic Sciences and Natural Resources Research, CAS, Beijing 100101, China
  • show less
    DOI: 10.1007/s11442-020-1778-8 Cite this Article
    Chi ZHANG, Shaohong WU, Guoyong LENG. Possible NPP changes and risky ecosystem region identification in China during the 21st century based on BCC-CSM2[J]. Journal of Geographical Sciences, 2020, 30(8): 1219 Copy Citation Text show less
    (a) Scatter plot between GPP and NPP from an example grid cell in June from 2015-2100 (The line is the linear fit. r represents the correlation coefficient.); (b) Correlation coefficient distribution between GPP and NPP in June from 2015-2100 (Grids shown are all significant at the 0.05 level.)
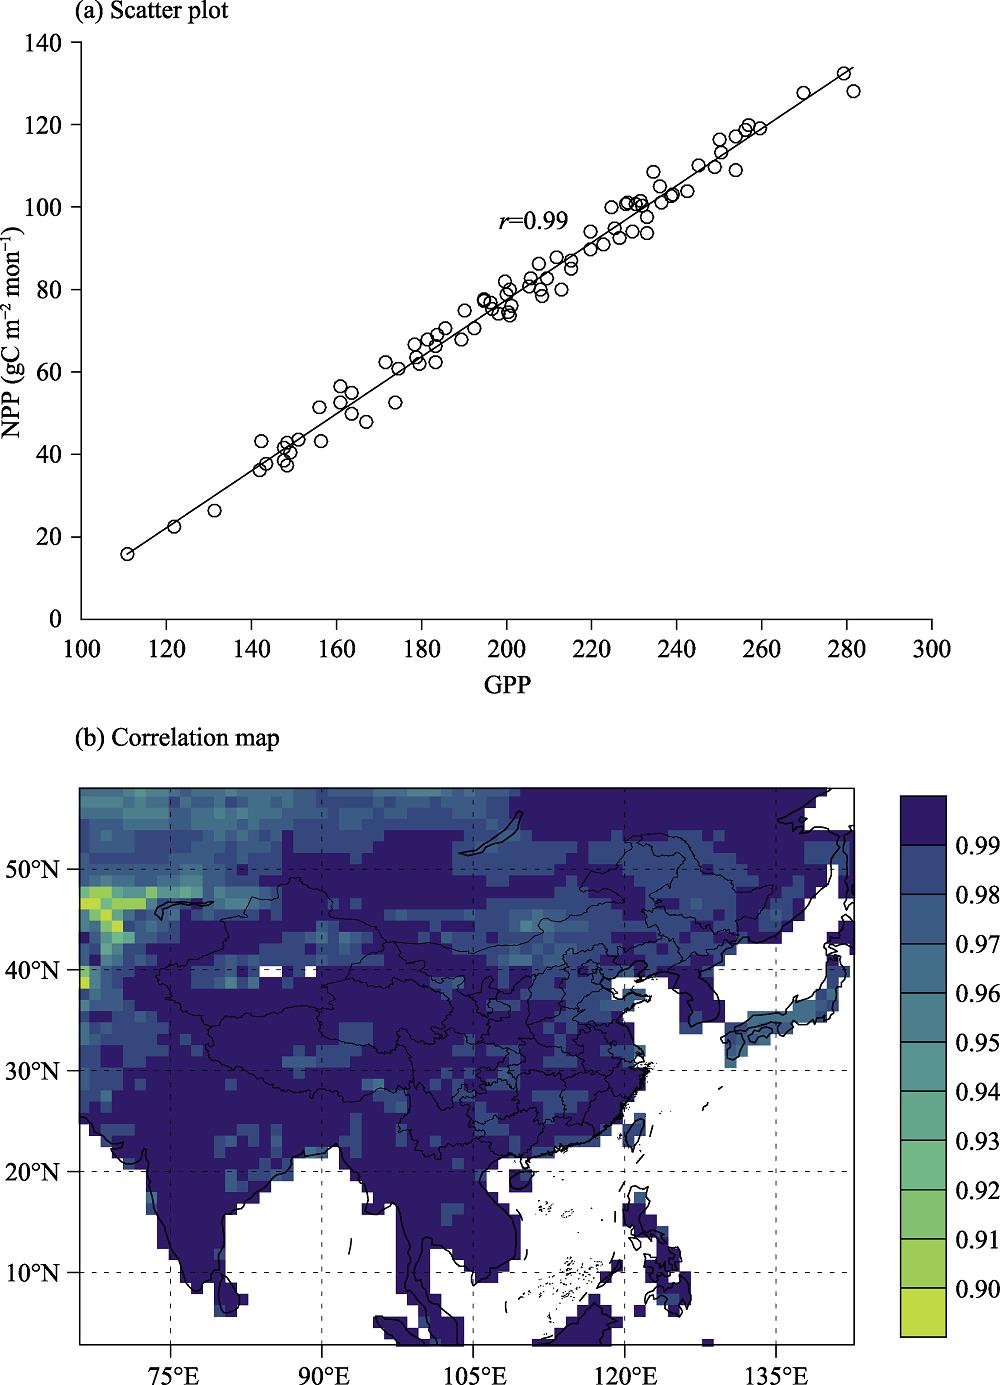
    Fig. 1. (a) Scatter plot between GPP and NPP from an example grid cell in June from 2015-2100 (The line is the linear fit. r represents the correlation coefficient.); (b) Correlation coefficient distribution between GPP and NPP in June from 2015-2100 (Grids shown are all significant at the 0.05 level.)
    Annual mean GPP distribution (gC m-2 a-1) during 1980-2013 with BCC-CSM2 before (a) and after (b) quantile mapping, and with observational FLUXNET (c)
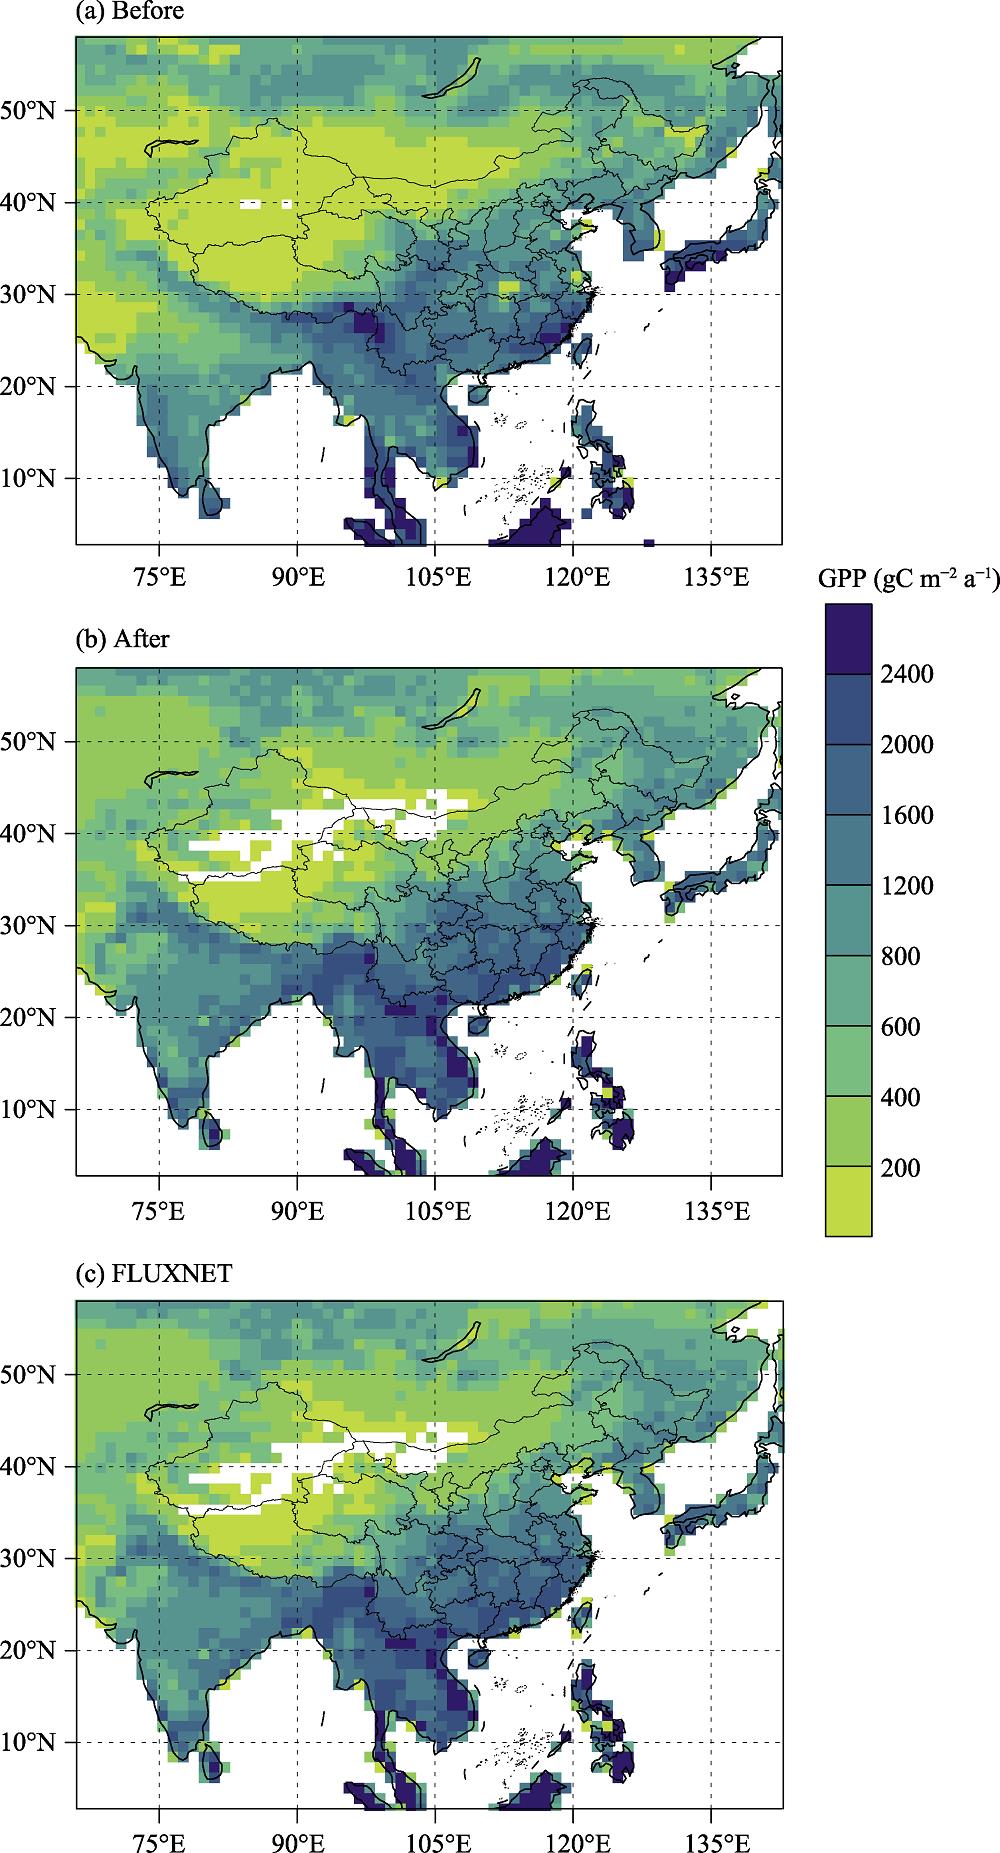
    Fig. 2. Annual mean GPP distribution (gC m-2 a-1) during 1980-2013 with BCC-CSM2 before (a) and after (b) quantile mapping, and with observational FLUXNET (c)
    Annual mean NPP (a and b, gC m-2 a-1) and the changing trend (c and d, gC m-2 a-1 dec-1) from 2015-2050 (The left and right plots are for the results before and after the transformation from GPP, respectively. The dots indicate the areas with significant trends at the 0.05 level.)
    Fig. 3. Annual mean NPP (a and b, gC m-2 a-1) and the changing trend (c and d, gC m-2 a-1 dec-1) from 2015-2050 (The left and right plots are for the results before and after the transformation from GPP, respectively. The dots indicate the areas with significant trends at the 0.05 level.)
    (a) The NPP changing trend in the latter part of the 21st century (gC m-2 a-1 dec-1) (The dots indicate the trends that are significant at the 0.05 level.); (b) The corresponding turning years (Only grids with negative trends in (a) are shown. The boxes represent the identified risky regions.)
    Fig. 4. (a) The NPP changing trend in the latter part of the 21st century (gC m-2 a-1 dec-1) (The dots indicate the trends that are significant at the 0.05 level.); (b) The corresponding turning years (Only grids with negative trends in (a) are shown. The boxes represent the identified risky regions.)
    NPP series from 2015-2100 for NER and SR (The dashed lines are the linear fit before and after the turning years.)
    Fig. 5. NPP series from 2015-2100 for NER and SR (The dashed lines are the linear fit before and after the turning years.)
    Temporal correlation coefficients from 2015-2100 between (a) temperature and NPP; (b) precipitation and NPP (The dots indicate the coefficients that are significant at the 0.05 level.); (c) The dominant climate factor that influences NPP (Yellow represents temperature. Blue represents precipitation. Gray represents both.)
    Fig. 6. Temporal correlation coefficients from 2015-2100 between (a) temperature and NPP; (b) precipitation and NPP (The dots indicate the coefficients that are significant at the 0.05 level.); (c) The dominant climate factor that influences NPP (Yellow represents temperature. Blue represents precipitation. Gray represents both.)
    Comparison between NPP and climate variables for (a) NER and (b) SR (The series are standardized. The dashed lines are the linear fit before and after the turning years.)
    Fig. 7. Comparison between NPP and climate variables for (a) NER and (b) SR (The series are standardized. The dashed lines are the linear fit before and after the turning years.)
    Same as Figure 7a but with non-corrected BCC-CSM2 data
    Fig. 8. Same as Figure 7a but with non-corrected BCC-CSM2 data
    BeforeAfter
    NPP-T0.06 (0.57)0.18 (0.10)
    NPP-P0.38 (0.00)0.23 (0.03)
    Table 1.

    The correlation parameter r between NPP and detrended climate factors in NER before and after bias correction (Values in blankets are significant levels.)

    Chi ZHANG, Shaohong WU, Guoyong LENG. Possible NPP changes and risky ecosystem region identification in China during the 21st century based on BCC-CSM2[J]. Journal of Geographical Sciences, 2020, 30(8): 1219
    Download Citation