
Shunfa Gong, Ruirui Wu, Sen Yang, Lifang Wu, Minmin Zhang, Qiuju Han, Wenzhi Wu. Tuning the luminous properties and optical thermometry of Cs2SnCl6 phosphor microcrystals via Bi and Sb codoping[J]. Photonics Research, 2021, 9(11): 2182
- Photonics Research
- Vol. 9, Issue 11, 2182 (2021)
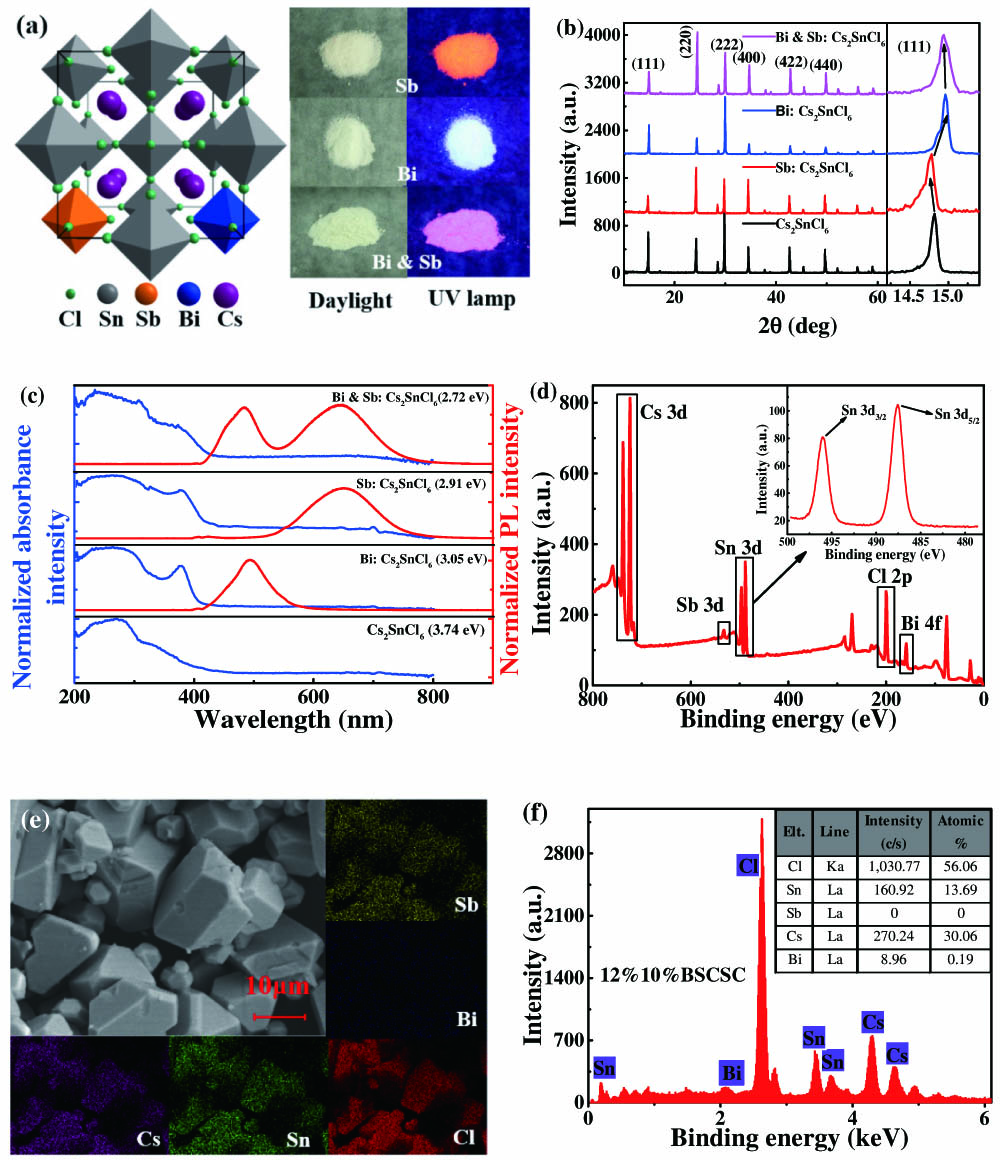
Fig. 1. (a) Crystal structure of BSCSC MCs and the pictures of a series of sample under daylight and UV lamp. (b) XRD patterns of Cs 2 SnCl 6 Cs 2 SnCl 6 Cs 2 SnCl 6 Cs 2 SnCl 6
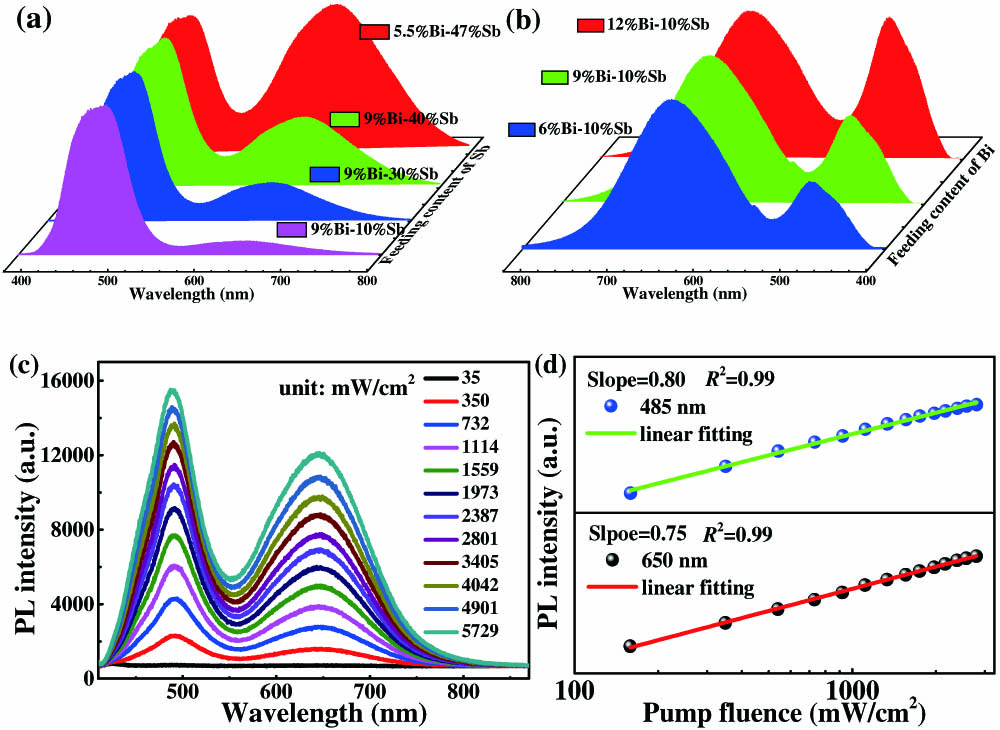
Fig. 2. PL spectra of BSCSC MCs with different (a) Bi and (b) Sb feeding contents. (c) PL spectra of 12%10%BSCSC MCs at 405 nm CW laser excitation under different pump fluences. (d) The linear fitting between PL intensity and pump fluence.
Fig. 3. (a) PL intensity of 12%10%BSCSC MCs at 80–380 K. (b) Pseudocolor map of PL intensity at 80–380 K. (c) The PL integral intensity of 12%10%BSCSC MCs at various temperatures. (d) The peak position with the change of temperature.
Fig. 4. (a) TRPL decay curves of 9%Biy % (y = 0 Cs 2 SnCl 6 x % (x = 0 Cs 2 SnCl 6
Fig. 5. Temperature-dependent TRPL decay curves of 12%10%BSCSC MCs from 190 to 400 K at the wavelength of (a) 485 nm and (b) 650 nm. (c) PL lifetime with temperature increasing. (d) Schematic energy diagram for BSCSC MCs. (e) The lifetime of 485 nm emission under 290–390 K. (f) S A S R
Fig. 6. (a) Electrically driven PL of white-emission LED based on Bi-and-Sb-codoped Cs 2 SnCl 6
|
Table 1. Several Thermometric Materials and Their Relative Sensitivity

Set citation alerts for the article
Please enter your email address
© Copyright 2018-2021 | Chinese Laser Press. All Rights Reserved 沪ICP备15018463号-20