• Acta Optica Sinica
  • Vol. 42, Issue 9, 0930002 (2022)
Jingjing Shi1、2, Mengfan Li2、*, Yadong Hu2, Gaojun Chi2, Xiangjing Wang2, and Jin Hong1、2
Author Affiliations
  • 1School of Environmental Science and Optoelectronic Technology, University of Science and Technology of China, Hefei 230026, Anhui, China
  • 2Anhui Institute of Optics and Fine Mechanics, Chinese Academy of Sciences, Hefei 230031, Anhui, China
  • show less
    DOI: 10.3788/AOS202242.0930002 Cite this Article Set citation alerts
    Jingjing Shi, Mengfan Li, Yadong Hu, Gaojun Chi, Xiangjing Wang, Jin Hong. Spectral Calibration and Matching Method for Ultraviolet-Visible Polarization Imaging Spectrometer[J]. Acta Optica Sinica, 2022, 42(9): 0930002 Copy Citation Text show less
    Optical system of instrument
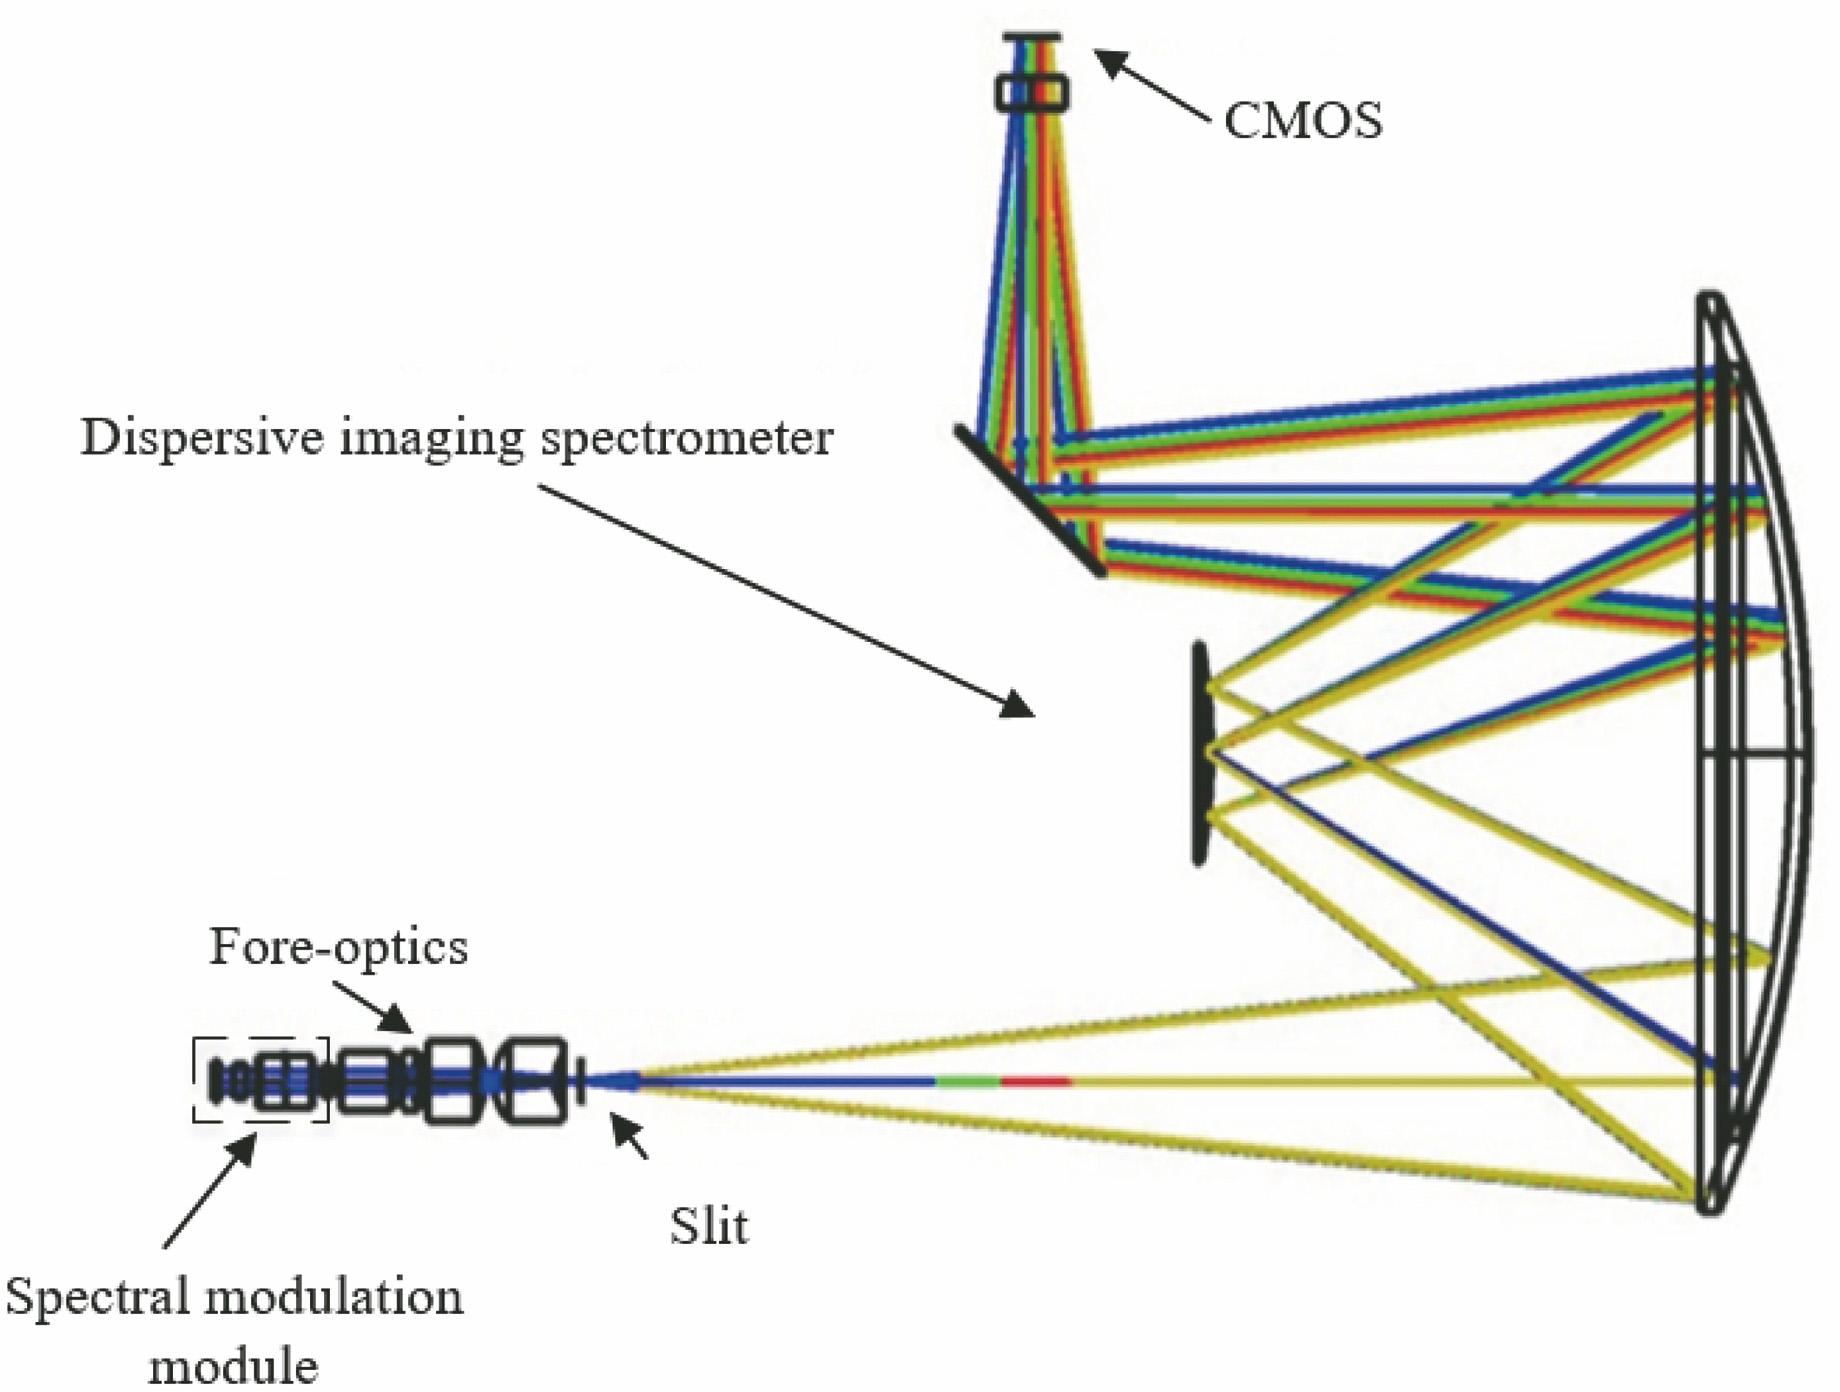
    Fig. 1. Optical system of instrument
    Schematic diagram of spectral modulation module
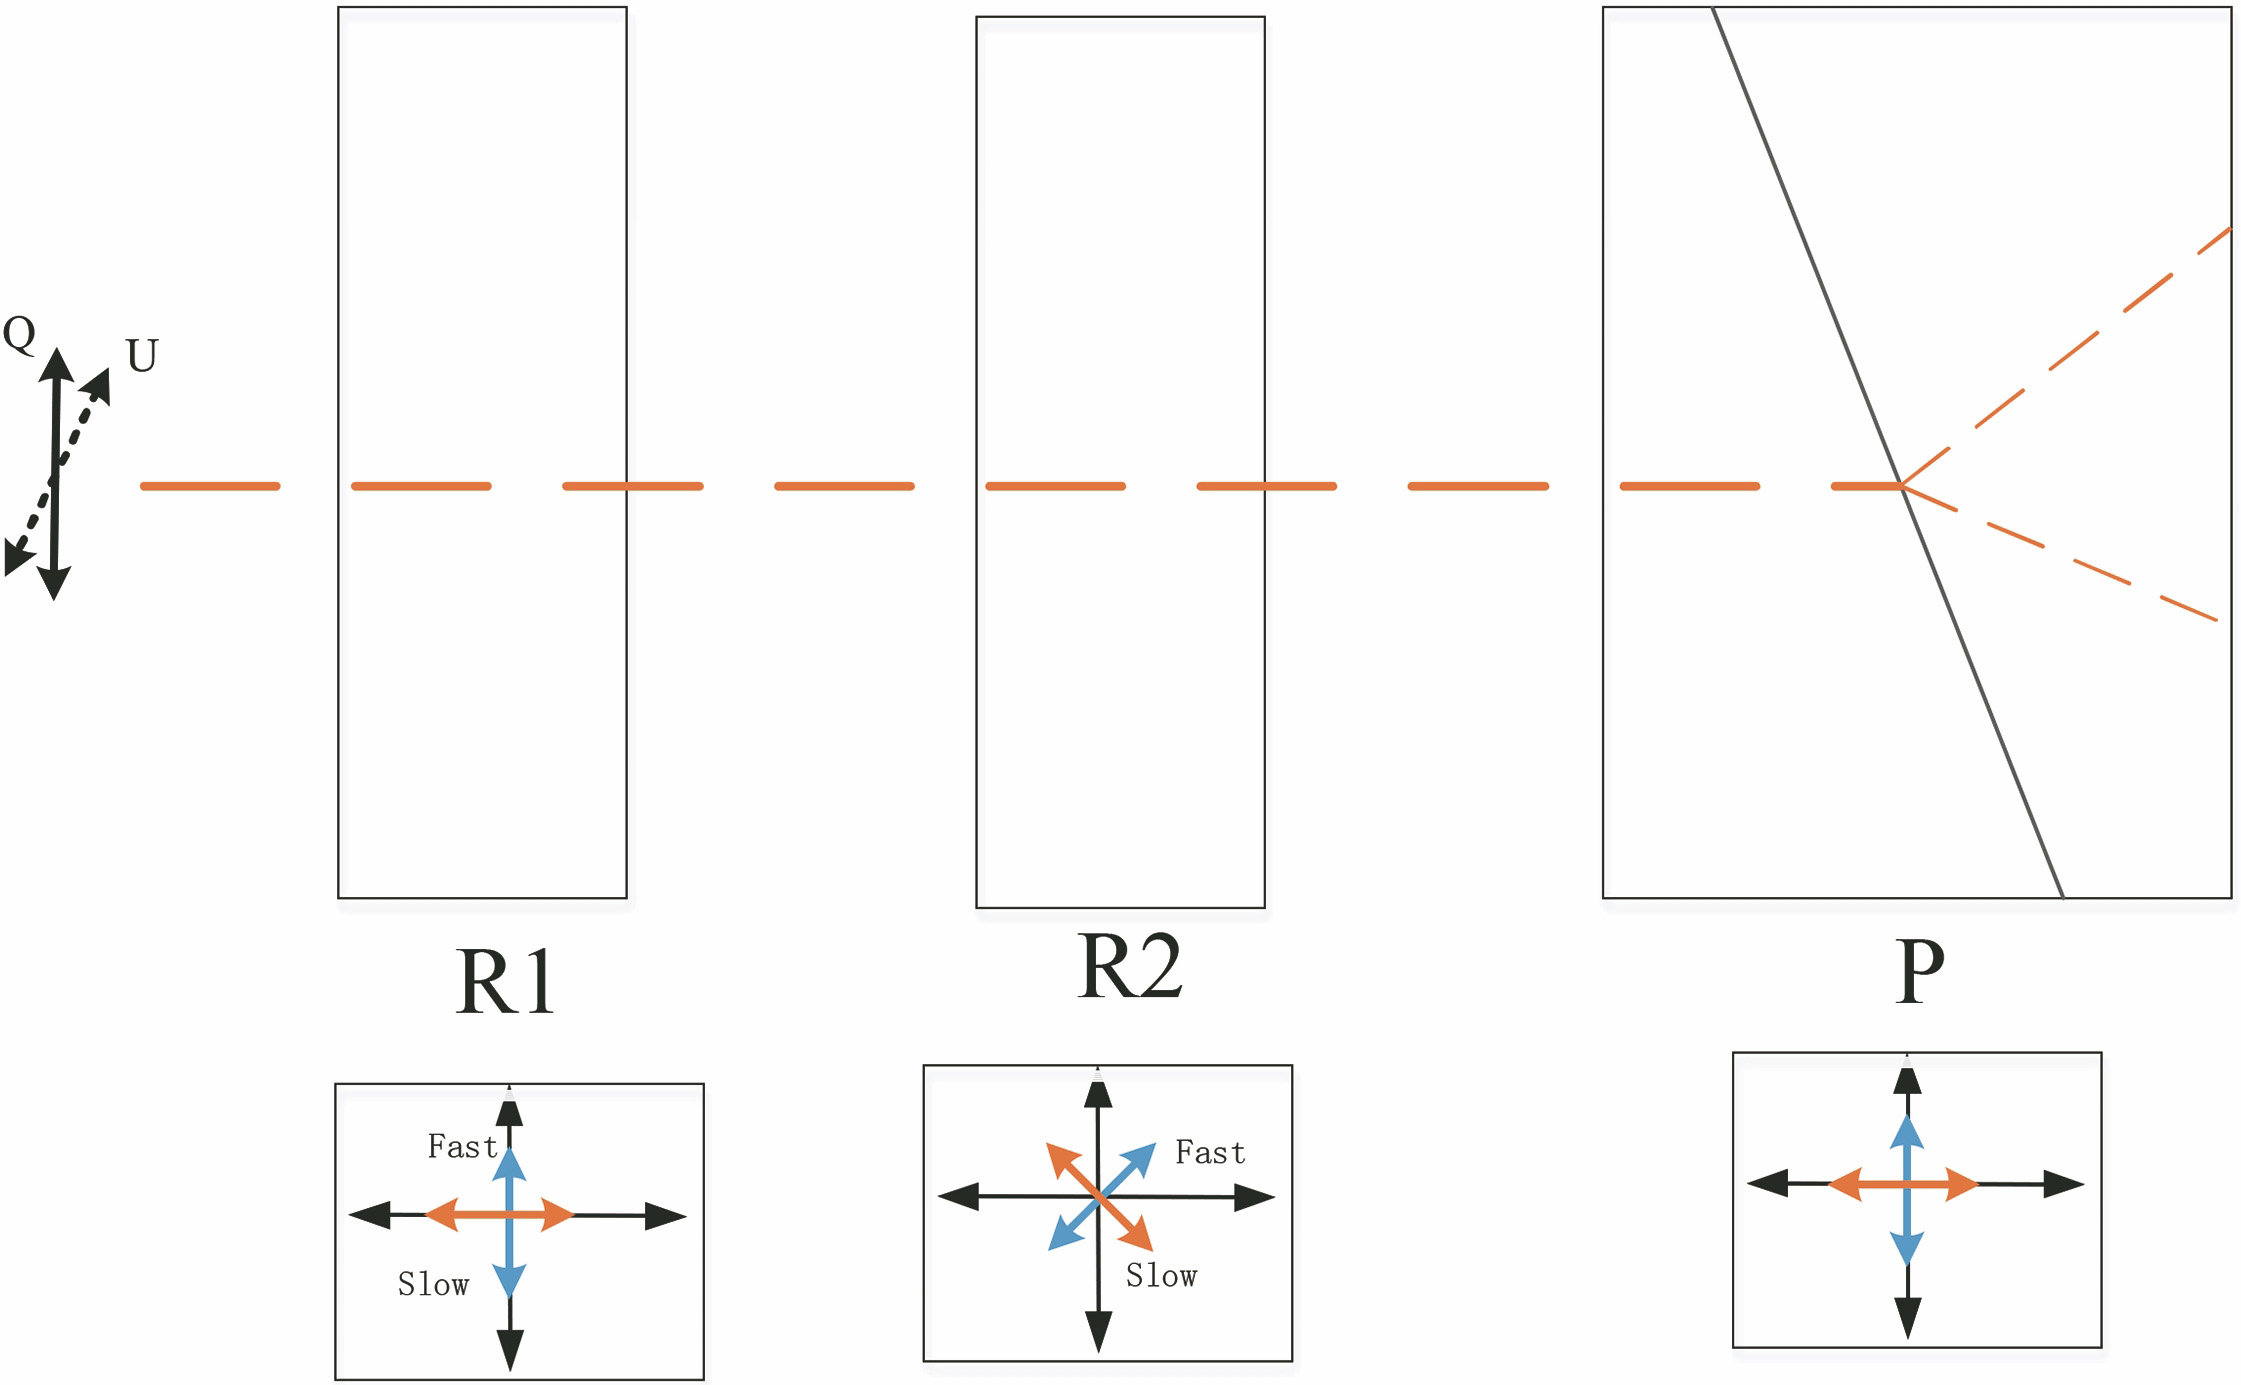
    Fig. 2. Schematic diagram of spectral modulation module
    Field of view calibration site
    Fig. 3. Field of view calibration site
    Image of parallel light acquired by detector
    Fig. 4. Image of parallel light acquired by detector
    Fitting results. (a) S beam; (b) P beam
    Fig. 5. Fitting results. (a) S beam; (b) P beam
    Pixel collection at different field of view. (a) S beam; (b) P beam
    Fig. 6. Pixel collection at different field of view. (a) S beam; (b) P beam
    Field of view calibration regression lines. (a) S beam; (b) P beam
    Fig. 7. Field of view calibration regression lines. (a) S beam; (b) P beam
    Schematic diagram of spectral calibration experiment
    Fig. 8. Schematic diagram of spectral calibration experiment
    Spectral image of mercury lamp acquired by detector
    Fig. 9. Spectral image of mercury lamp acquired by detector
    Spectra of mercury lamp. (a) S beam; (b) P beam
    Fig. 10. Spectra of mercury lamp. (a) S beam; (b) P beam
    Spectral response curves of instrument at 404.66 nm of mercury lamp characteristic spectral line. (a) S beam; (b) P beam
    Fig. 11. Spectral response curves of instrument at 404.66 nm of mercury lamp characteristic spectral line. (a) S beam; (b) P beam
    Spectral calibration regression lines. (a) S beam; (b) P beam
    Fig. 12. Spectral calibration regression lines. (a) S beam; (b) P beam
    Schematic diagram of outdoor experiment
    Fig. 13. Schematic diagram of outdoor experiment
    Solar spectrum acquired by instrument
    Fig. 14. Solar spectrum acquired by instrument
    Wavelength /nmPixel of center peak
    S beamP beam
    365.02820.79821.72
    404.66966.11966.93
    407.78977.57978.42
    435.831080.591081.42
    546.071485.681486.46
    Table 1. Wavelength-pixel matching relationship
    Channelσ21σ22σ23σ2
    S0.010.0270.03160.043
    P0.010.0270.03860.048
    Table 2. Uncertainty of spectral calibrationnm
    Absorption elementStandard wavelengthCalibration wavelengthDeviation
    S beamP beamS beamP beam
    Ca+393.37393.38393.330.010.04
    Ca+396.84396.82396.80.020.04
    410.18410.16410.10.020.08
    434.05434.09434.040.040.01
    Fe466.81466.83466.780.020.03
    486.13486.09486.120.040.01
    Table 3. Comparison of calibration value and standard value of Fraunhofer linesnm
    Jingjing Shi, Mengfan Li, Yadong Hu, Gaojun Chi, Xiangjing Wang, Jin Hong. Spectral Calibration and Matching Method for Ultraviolet-Visible Polarization Imaging Spectrometer[J]. Acta Optica Sinica, 2022, 42(9): 0930002
    Download Citation