
Yunyun LI, Haiyang LIU, Ling-en WANG. Spatial Distribution Pattern of the Catering Industry in A Tourist City: Taking Lhasa City as A Case[J]. Journal of Resources and Ecology, 2020, 11(2): 191
- Journal of Resources and Ecology
- Vol. 11, Issue 2, 191 (2020)
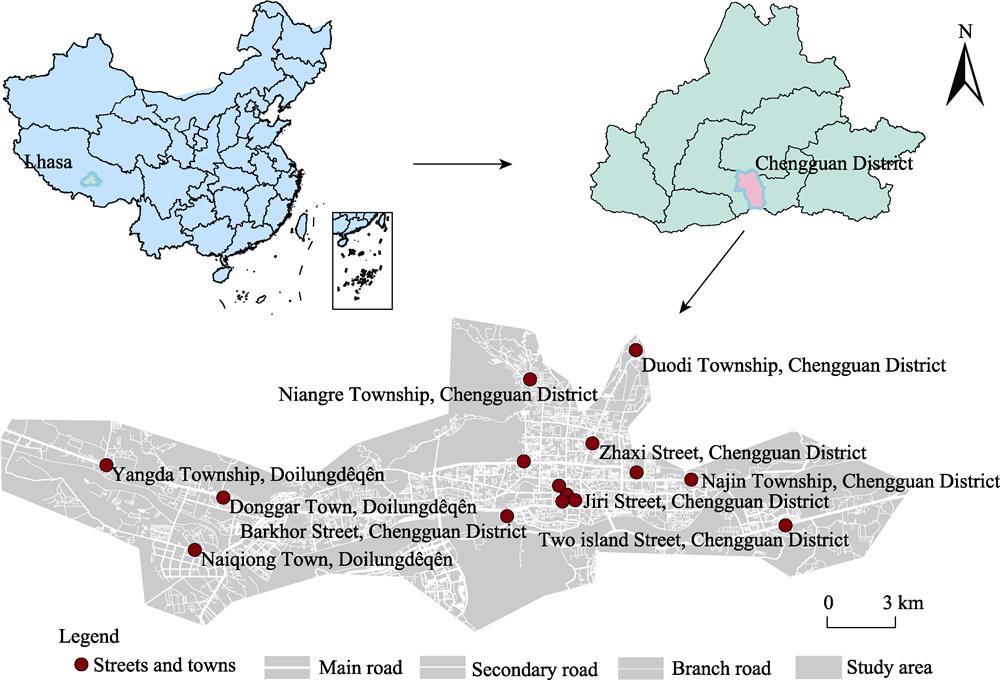
Fig. 1. Location of study area
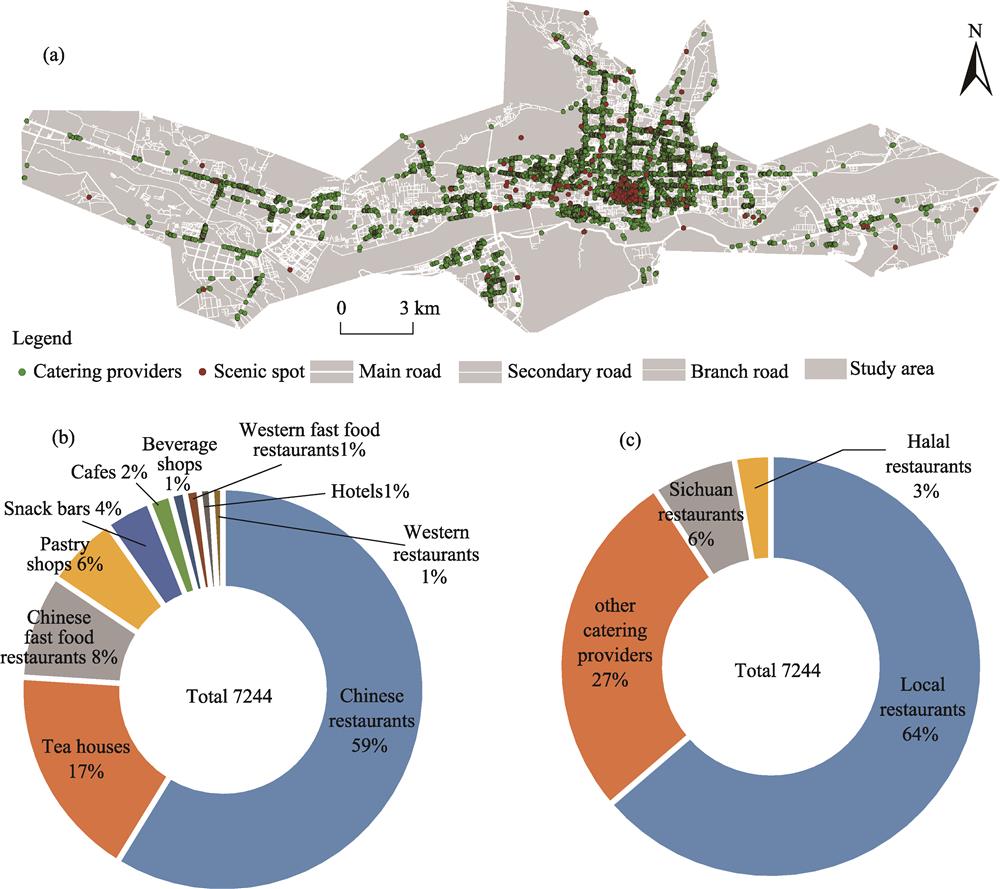
Fig. 2. Distribution of catering providers in the study area Note: (a) the spatial distribution of catering providers in Lhasa’s main city area; (b) the proportions of different kinds of catering providers; and (c) the proportions of the different cuisines of catering providers.
Fig. 3. Standard deviational ellipse of catering providers for (a) different kinds of catering providers and (b) different cuisine types provided by the various kinds of catering providers
Fig. 5. Kernel density estimation of catering providers’ different cuisines types: (a) local; (b) Sichuan; (c) Halal and (d) all others.
Fig. 6. Buffer analysis for different kinds of roads: (a) main roads; (b) secondary roads and (c) branch roads.
Fig. 7. (a) Kernel density estimation of scenic spots and (b) the spatial distribution of different kinds of scenic spots
Fig. 8. Buffer analysis of (a) all scenic spots within the 500 m buffer range, (b) all scenic spots within the 1000 m buffer range, (c) 2A level and above scenic spots in the 1000 m buffer range and (d) 2A level and above scenic spots in the 2000 m buffer range.
Fig. 9. Spatial distribution of (a) population in the main city area of Lhasa, and the distribution of population overlaid with (b) all catering providers, (c) local restaurants, (d) Sichuan restaurants and (e) Halal restaurants.
Fig. 10. Population heat map in the Main City Area of Lhasa.
|
Table 1.
Average nearest neighbor analysis results for different kinds of catering providers
|
Table 2.
Catering provider quantities in buffer areas of different levels of roads and their proportions within the total number of catering providers.
|
Table 3.
Catering provider distribution within varying buffer ranges of the scenic spots.

Set citation alerts for the article
Please enter your email address
© Copyright 2018-2021 | Chinese Laser Press. All Rights Reserved 沪ICP备15018463号-20