
Yunyun LI, Haiyang LIU, Ling-en WANG. Spatial Distribution Pattern of the Catering Industry in A Tourist City: Taking Lhasa City as A Case[J]. Journal of Resources and Ecology, 2020, 11(2): 191
- Journal of Resources and Ecology
- Vol. 11, Issue 2, 191 (2020)
Abstract
1 Introduction
Catering consumption is a basic consumer demand that is very close to people’s livelihoods (
The geospatial organization of economic activities is a core element of economic geography research (
However, related investigations in China have only begun more recently. Research content mainly focuses on the spatial distribution characteristics of the catering industry and the factors which influence its spatial layout. Studies on spatial distribution characteristics primarily consider the spatial pattern of the catering industry in a single geographical unit and the spatial distribution of a single catering business (
Studies have shown that the spatial layout of the catering industry is affected by macro-factors (e.g. regional policy systems, economy, and culture), meso-factors (e.g. traffic convenience and distribution of tourism resources), and micro-factors (e.g. population density and distribution and consumer behaviour), among others (
Analytical methods commonly used for investigating the spatial layout of the catering industry include several spatial analysis methods, such as kernel density analysis, the standard deviational ellipse, and buffer analysis (
With the rapid development of big data technology, new geographic data sources are constantly being explored, such as point of interest (POI) data, mobile phone signalling data, GPS user behaviour tracking data, and evaluation data on the Internet (e.g. Dianping.com) (
Therefore, this paper uses Lhasa, Tibet to study the spatial layout structure and characteristics of the catering industry in a tourism-heavy city on the plateau. For this analysis, POI data is mined for catering providers and scenic spots. In addition, the interaction mechanisms between the catering industries and the tourism industries, regarding the layout and development of each in this tourism-heavy city, are analysed with regard to three aspects: traffic distribution, tourism resource distribution and population distribution. Ultimately, this study aims to provide a scientific basis to guide and promote the spatial structure optimization of the tourism industry’s development, as well as the healthy development of tourism.
2 Materials and methods
2.1 Study area
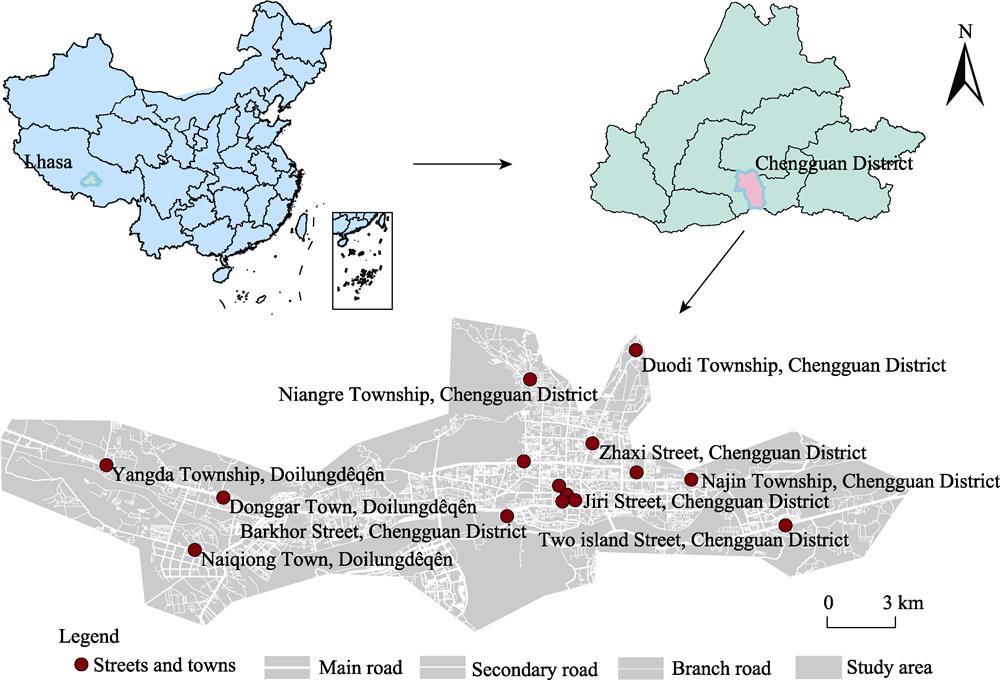
Lhasa is in an important geographical location that is rich with tourism resources. First, the city is the capital of the Tibet Autonomous Region. The city is located in the hinterland of the Qinghai-Tibet Plateau, in the southeast of the Tibet Autonomous Region, on the northern bank of the Lhasa River, and a tributary of the Yarlung Zangbo River. It has geographical coordinates of 91°06′ E, 29°36′ N, with an average elevation of more than 3650 m. Second, the registered population in Lhasa was 688300 by the end of 2017 (
Finally, Lhasa is an international tourism city with prominent characteristics regarding its religious and uniquely Tibetan customs. Recently, tourism has become one of the leading industries in the area, and Lhasa received more than 19.9 million domestic and foreign tourists in 2018, which was an increase of 24.38% from 2017 (
![]()
Figure 1.Location of study area
2.2 Data sources and classification
Data on the catering providers (e.g. hotels, restaurants, cafes, etc.), scenic spots, roads and resident populations (e.g. resident population and instant population) were included in this study. The data on catering providers was comprised of POI data collected from Gaode Map in February 2019; the road data was from the Gaode Map Road network; the population data was from the National Sixth Census data in China (
2.3 Study methods
Based on ArcGIS 10.2 software, this study investigates the overall spatial distribution mode of catering providers in Lhasa through average nearest neighbor analysis (ANNA) and the standard deviational ellipse (SDE). The space agglomeration feature of catering providers is also considered with kernel density estimation (KDE). The main factors affecting the spatial layout structure of the catering industry are also investigated with a buffer analysis with regard to traffic, tourism resources and resident population.
2.3.1 Average Nearest Neighbor Analysis
ANNA is commonly used to analyse the distribution patterns of features in space. The average nearest neighbor ratio (
where
where,
In addition, the formula for the average nearest neighbor
where
2.3.2 Standard Deviational Ellipse
SDE is a method commonly used to measure the distribution trend of a set of points or regions. It was proposed by D. Welty Lefever, a sociology professor at the University of Southern California in 1926, and is also called Lefever’s “Standard Deviational Ellipse” (
where
such that
The standard deviations of the
The long semi-axis of the ellipse represents the direction of the element distribution, and the short semi-axis represents the range of the element distribution. The larger the difference between the long semi-axis and the short semi-axis (i.e. the larger the flattening ratio), the more obvious the directionality of the element. Conversely, if the long semi-axis and the short semi-axis are more similar, then the directionality is less noticeable.
2.3.3 Kernel Density Estimation
KDE is a density function used to estimate unknowns in probability theory. It is one of the nonparametric test methods. KDE is characterized by the absence of a definite functional form, and density calculations through function parameters using known data points for estimation. KDE is an effective way to visualize spatial point information and it is widely used in research on the spatial distributions of natural resources, human resources and infrastructure (
where
2.3.4 Buffer analysis
Buffer analysis refers to automatically creating a buffer polygon layer within a certain width range based on points, lines, and surface entities, and then superimposing that layer with the target layer to obtain the desired result. Buffer analysis is one of the spatial analysis tools used to solve proximity problems. Here, buffer analysis was used to analyse the impacts of traffic and tourism resources on the spatial distributions of catering providers.
To consider the impact of traffic distribution, the buffer radius of main roads, secondary roads and branch roads were set as 150 m, 100 m, and 50 m, respectively. For the impact of tourism resource distribution, the buffer radius of each attraction was set as 500 m and then 1000 m, while the buffer radius of each scenic spot above the 2A-level was set as 1000 m and then 2000 m. After obtaining the buffer range of a road/scenic spot, the catering providers in the area were intersected with the buffer ranges of different grades (Intersect), generating distribution maps of catering providers within different road/scenic spot buffer zones.
Before performing calculations of the SDE, ANNA, and KDE, and the buffer analysis, all POI data in the study area were projected and coordinated. The projection coordinates were defined as WGS_1984_UTM_Zone_46N to ensure data consistency based on the location of Lhasa. For the population heat map, reclassification (heat value: 1-7) (
3 Results
3.1 Spatial distribution characteristics of the
catering industry in Lhasa
3.1.1 Overall distribution characteristics
There is a total of 7244 catering providers in the study area. Regarding different cuisine types, more than half of these providers are Chinese restaurants, at 59%, followed by tea houses, at 17%, and then Chinese fast food restaurants, at 8% (
![]()
Figure 2.Distribution of catering providers in the study area Note: (a) the spatial distribution of catering providers in Lhasa’s main city area; (b) the proportions of different kinds of catering providers; and (c) the proportions of the different cuisines of catering providers.
3.1.2 Spatial distribution pattern
The distribution of catering providers has a significant aggregation pattern. For all catering providers, the result of ANNA showed that
| Catering providers | Observed mean distance (m) | Expected mean distance (m) | Nearest neighbour ratio | |||
|---|---|---|---|---|---|---|
| All catering providers | 26.8839 | 113.3963 | 0.237079 | -95.216245 | 0 | |
| Different kinds of catering providers | Chinese restaurant | 18.8288 | 86.9181 | 0.216627 | -127.552406 | 0 |
| Chinese fast food restaurant | 82.0259 | 300.0183 | 0.273403 | -34.274909 | 0 | |
| Tea house | 67.0662 | 209.3236 | 0.320395 | -45.948244 | 0 | |
| Western restaurant | 323.4324 | 903.7787 | 0.357867 | -10.055262 | 0 | |
| Pastry shop | 139.0467 | 358.8435 | 0.387486 | -24.156927 | 0 | |
| Snack bar | 186.8654 | 451.0486 | 0.414291 | -18.377602 | 0 | |
| Beverage shop | 355.9832 | 802.3984 | 0.443649 | -9.812716 | 0 | |
| Cafe | 293.8510 | 646.3442 | 0.454635 | -11.941351 | 0 | |
| Western fast food restaurant | 385.0135 | 816.9446 | 0.471285 | -9.159245 | 0 | |
| Hotel | 467.4488 | 877.9511 | 0.532431 | -7.537118 | 0 | |
| Different cuisines of catering provides | Local restaurant | 26.0471 | 108.8846 | 0.239218 | -98.883560 | 0 |
| Other catering providers | 50.1552 | 167.1834 | 0.300001 | -59.256315 | 0 | |
| Halal restaurant | 213.3069 | 520.5037 | 0.409809 | -16.047207 | 0 | |
| Sichuan restaurant | 153.8062 | 341.9610 | 0.449777 | -22.771546 | 0 |
Table 1.
Average nearest neighbor analysis results for different kinds of catering providers
The distributions of various catering providers are similar, generally extending in the “east-west” direction (
![]()
Figure 3.Standard deviational ellipse of catering providers for (a) different kinds of catering providers and (b) different cuisine types provided by the various kinds of catering providers
3.1.3 Spatial agglomeration feature
The results of the KDE for catering providers indicate that:
(1)Chinese fast food restaurants are mainly concentrated in Chengguan District, in multiple groups (Fig. 4a); they are mainly concentrated in the vicinity of the Jokhang Temple, Sun Island, Tianhai Commercial Circle, Niangjiao Road and the intersection of Dangxi Road and Zaki Temple. Most of them are concentrated in the Old City of Lhasa. There is also a central distribution on the edge of the city.
(2)Fig. 4 Kernel density estimation of different kinds of catering providers: (a) Chinese fast food restaurants; (b) Chinese restaurants; (c) Western fast food restaurants; (d) Western restaurants; (e) hotels; (f) beverage shops; (g) snack bars; (h) cafes; (i) pastry shops; (j) tea houses and (k) all catering providers combined.
(2) Chinese restaurants have a wider spatial distribution than Chinese fast food restaurants. Furthermore, the Chinese restaurant centre has a higher concentration value than that of any other restaurant types, which is also the highest of all kinds of catering providers (
(3) Western fast food restaurants and Western restaurants have a smaller spatial distribution and are concentrated in fewer areas (Figs. 4c-4d). For example, Western fast food restaurants are concentrated at Jokhang Temple, at the intersection of Niang Hot Road and Dangxi Road and in the vicinity of Lhasa Teachers College. Western restaurants are concentrated at Jokhang Temple and in the Tianhai Business District. In general, Western fast food restaurants and Western restaurants are far less distributed and less concentrated than either Chinese fast food restaurants or Chinese restaurants.
(4) Hotels are more scattered in their spatial distribution and are mostly distributed outside the core area of Lhasa (
(5) The overall distribution characteristics of all catering providers overlap with the sub-types of catering providers in the spatial agglomeration area (
Regarding cuisine types, the local restaurant cuisine type is the most widely distributed in its spatial distribution. It is concentrated in the centre of the Chengguan District (Jokhang Temple area), wherein the centre has the highest concentration, which is far more than those of the other cuisine types (
3.2 Impact factors of the catering industry’s spatial distribution
3.2.1 Traffic distribution
The spatial layout of the catering industry in Lhasa is largely influenced by the convenience of transportation. The catering providers are mainly distributed on both sides of the road or at the intersections of roads, reflecting the road network’s influence in spatially shaping the catering industry (
In terms of quantity, the number of catering providers within the secondary road buffer is the largest (
| Buffer area | Number of catering providers | Proportion (%) |
|---|---|---|
| 150 m range buffer of main road | 1768 | 24.41 |
| 100 m range buffer of secondary road | 5737 | 79.20 |
| 50 m range buffer of branch road | 5442 | 75.12 |
Table 2.
Catering provider quantities in buffer areas of different levels of roads and their proportions within the total number of catering providers.
3.2.2 Tourism resource distribution
The results of the kernel density analysis show that the scenic spots are most concentrated near the Jokhang Temple, followed by Potala Palace (
![]()
Figure 5.Kernel density estimation of catering providers’ different cuisines types: (a) local; (b) Sichuan; (c) Halal and (d) all others.
![]()
Figure 6.Buffer analysis for different kinds of roads: (a) main roads; (b) secondary roads and (c) branch roads.
The results of the buffer analysis of scenic spots indicate that 54.67% of catering providers are within the 500 m buffer zone of a scenic spot, and 85.59% of catering providers are within the 1000 m buffer zone of a scenic spot, indicating that the spatial layout of the catering industry has a strong dependence on tourism resources. Among catering providers, 20.83% are located within the 1000 m buffer zone of the scenic spots above 2A-level, and 49.12% are within the 2000 m buffer zone, indicating that the high- level scenic spots integrally impact the spatial layout of the catering industry (
| Buffer range | Number of catering providers | Proportion (%) |
|---|---|---|
| 500 m | 3960 | 54.67 |
| 1000 m | 6196 | 85.59 |
| Above 2A-level 1000 m | 1509 | 20.83 |
| Above 2A-level 2000 m | 3558 | 49.12 |
Table 3.
Catering provider distribution within varying buffer ranges of the scenic spots.
3.2.3 Population distribution
The distributions of permanent residents and the catering industry are somewhat related (
![]()
Figure 7.(a) Kernel density estimation of scenic spots and (b) the spatial distribution of different kinds of scenic spots
![]()
Figure 8.Buffer analysis of (a) all scenic spots within the 500 m buffer range, (b) all scenic spots within the 1000 m buffer range, (c) 2A level and above scenic spots in the 1000 m buffer range and (d) 2A level and above scenic spots in the 2000 m buffer range.
However, the population heat map shows the distribution of the concentration of catering providers is highly consistent with that of the instant population (
![]()
Figure 9.Spatial distribution of (a) population in the main city area of Lhasa, and the distribution of population overlaid with (b) all catering providers, (c) local restaurants, (d) Sichuan restaurants and (e) Halal restaurants.
4 Discussion and conclusions
This study considers the catering network of Lhasa, Tibet as the research object. By mining POI data from the Gaode map, the spatial distribution pattern of catering providers and its influencing factors in the main city area of Lhasa were analysed. The findings could provide a scientific basis and guidance for promoting the spatial structural optimization of the catering industry in this tourism-heavy city on the plateau, as well as the healthy development of tourism in other areas.
More than half of catering providers within the study area are Chinese restaurants, followed by tea houses (17%) and Chinese fast food restaurants (8%). As a unique symbol of food culture in Tibetan areas, Tibetan tea is an important part of residents’ lives in Lhasa. Therefore, in Lhasa’s catering industry, the number of tea house is second only to Chinese restaurants. Among the different cuisine types among catering providers, the local restaurant type is the most prevalent (64%). Sichuan is a neighbouring province of Tibet. Many Sichuanese individuals and companies operate in the catering industry in Lhasa as a result of the rapid development of tourism in the area, and this area is renowned for its Sichuan cuisine. For example, the migration data released by Baidu in 2014 showed that Chengdu and Chongqing are both popular areas for moving in and out of Tibet, indicating that Sichuan and Chongqing people constituted a significant portion of the migrant population in Tibet (
The catering industry in the study area shows a two main, two secondary and multi-centre spatial distribution patterns. Catering providers are centrally located in the Old City of Lhasa. Overlaps exist among the different kinds of gathering centres for catering providers. Chinese fast food restaurants and Chinese restaurants are the most widely distributed restaurants among all types of catering providers. Other than the single-centre distributions of beverage shops, snack bars, cafes and pastry shops, the distributions of the rest of the catering providers are all multi-centred. In addition to forming a gathering centre around the scenic spots of the Old City, different kinds of catering providers are also distributed in a beaded manner in the space affected by the distribution of the main roads. For the spatial distribution patterns of the different cuisines of catering providers, local restaurants have the dominant position with both the highest concentration and the widest distribution, and the gathering centre of the local restaurants is at the Jokhang Temple area. In comparison, the concentrations of Sichuan restaurants and Halal restaurants are lower, relatively, and their concentration centres are shifted to either side of the Old City, forming a gathering centre in an area where local restaurants are not dominant.
The spatial layout of the catering industry in Lhasa is largely influenced by the convenience of transportation, the distribution of scenic spots and the distribution of the instant population. Catering providers are primarily distributed on either side of roads or at the intersections of roads, reflecting the influence of the road network on spatially shaping the distribution of catering providers. Roads with lower grades and slower speeds, i.e. branch roads, are more attractive to catering businesses and pedestrians. Particularly in areas with dense branch roads, where the road traffic environment is typically more friendly to pedestrians, catering providers are more clustered. Accordingly, roads integrally affect the layout of the catering industry.
The gathering centres of the catering industry and scenic spots are basically coincident, both have gathering centres in the Jokhang Temple area, indicating a strong correlation between the spatial distributions of the catering industry and scenic spots. Further exploration of the impact of high-level tourism resources (i.e., above 2A level scenic spots) on the distribution of the catering industry found that nearly half of all catering providers are concentrated within 2 km of these scenic spots. This suggests that the spatial layout of the catering industry has a strong dependence on high-level tourism resources, such as the scenic spots above the 2A level. Dependence on high-level tourism resources is also a major feature of the spatial layout of the tourism facilities in a tourism-rich city. The distributions of permanent residents and the catering industry are only somewhat related, as the population of permanent residents does not entirely coincide with the concentration or distribution of the catering industry. However, the concentration distribution of catering providers is highly consistent with the concentration distribution of the instant population.
The catering industry has become an important aspect of Lhasa’s function as a tourism city, and the rational layout of the catering industry determines whether the urban economy can operate smoothly. Therefore, in future urban planning processes for Lhasa, the development of the catering industry must be carefully guided and catering facilities must be well-planned. In forming a reasonable spatial layout of the catering industry, it should be considered as a key guiding factor in the future development direction of the city. While maintaining the original transportation convenience of the Old City in road traffic planning, it is also necessary to improve the accessibility of new roads by pedestrians. In activity organization, tourism resources and catering industry facilities should be coordinated and organized around tourism routes. Additionally, tour times of scenic spots, catering consumption and the distribution of accommodation businesses should be fully integrated with urban public transportation. This would enhance the ability to disperse and evacuate people when needed, thus avoiding the urban congestion that can be caused by consumption agglomeration.
One advantage of the POI data used in this study is that they are numerous while also reflecting dynamic changes. To a certain extent, these features overcome the limitations of non-comprehensiveness and time-effectiveness of past field survey data, as well as improve the accuracy of the research results. However, with the continuous development of the city, the catering industry continues to develop rapidly, with the number and types of catering providers constantly changing. Therefore, in future research, an analysis of the changing trends of the quantity, categories and grades of catering facilities in different time series (e.g. different years and seasons) should be considered. Because of the difficulty in obtaining long-term sequence data based on a given study scale and data acquisition technology level in the current space-time pattern evolution of the catering industry, future long-term sequence research should pay more attention to the impact of technical acquisition means (e.g. the level of detail of map features) on the spatial pattern evolution. Additionally, an acquisition and excavation analysis of network evaluation data of relevant websites (e.g. the public comment networks) should be conducted. This analysis could synthesize user preferences and behaviours with data regarding development of the catering industry, and thus further aim to comprehensively and accurately simulate the spatial layout structure and evolutionary trends of the catering industry in tourism cities. Ultimately, this analysis could provide a useful reference for urban and rural planning, tourism development and commercial investment.
Long J L. 2018. Lhasa’s tourism revenue reached 28.276 billion yuan, and the number of tourists received more than 1990 million this year http://www.tibet.cn/cn/news/zx/201812/t20181230_6469390.html. (
Ministry of Construction National Technical Supervision Bureau. 1995. Code for transport planning on urban road (GB50220-95). (in Chinese)
National Bureau of Statistics. 2017. Turnover of catering industry. http://data.stats.gov.cn/search.htm?s=%E9%A4%90%E9%A5%AE%E4%B8%9A2017. (
National Tourism Bureau. 2003. Standard of rating for quality of tourist attractions (GBT 17775-2003). (in Chinese)
People.cn. 2014. Tibet’s 8-hour migration map: Sichuan ranks first in the Tibetan passenger flow. http://xz.people.com.cn/n/2014/0212/c138901- 20553395.html. (
Population Census Office under the State Council of China, National Bureau of Statistics of China. 2012. Tabulation on the 2010 population census of People’s Republic of China. Beijing: China Statistics Press. (in Chinese)
Qin X, Zhen F, Zhu S J
Ren X Y. 2012. The spatial layout research of urban food and beverage block. Master diss., South China University of Technology. (in Chinese)
Ritter W. 1986. Hotel location in big cities. In: Vetter F (eds.). Big City Tourism. Berlin: Reimer Vetter: 355-356.
Schiff N. 2015. Cities and product variety: Evidence from restaurants.
Shu S Y, Wang R, Sun Y W
Tan X, Huang D Q, Zhao X S. 2016. A study on the spatial distribution pattern of restaurants in Beijing’s main urban area.
Tang J X, Huang J M, Liu L X
Tao H, Zhao Y, Yuan X Y
Tao W, Gu H Y, Chen H N. 2015. Guangzhou’s spatial distribution under the effect of the urban road network on the hotel industry.
Tibet Autonomous Region Statistics Bureau, Survey Office of the Bureau of Statistics in Tibet Autonomous Region. 2018. Tibet Statistical Yearbook. Beijing: China Statistics Press. (in Chinese)
Tibet Daily. 2017. Lhasa City’s tourism revenue in 2017 exceeded 22 billion yuan. http://www.gov.cn/shuju/2017-12/31/content_5251945.htm. (
Urtasun A, Gutierrez I. 2006. Hotel location in tourism cities: Madrid 1936-1998.
Wall G, Dudycha D, Hutchinson J. 1985. Point pattern analyses of accomodation in Toronto.
Wang B. 2013. A spatial distribution feature and regional disparity study on international chain catering enterprises in mainland China. Master diss., Nanjing University. (in Chinese)
Wang D, Wang C, Xie D C
Wang L C. 2018. Spatial-temporal characteristics of urban population aggregation based on baidu heat map in central areas of Wuhan City.
Wu C F. 2016. Study on spatial agglomeration of catering industry in Shanghai. Maser diss., Zhejiang University. (in Chinese)
Xia L J, Liu Y F, Liu G W. 2018. Spatial distribution pattern and influencing factors of catering industry in prefecture level and above cities in China: An empirical study based on the dianping.com data.
Xin H, Bu C Z. 2018. Research on spatial pattern change of Beijing-Tianjin-Hebei services based on standard deviation ellipse analysis.
Xu K. 2016. The study of space distribution of catering trade in Changsha urban area based on online review. Master diss., Hunan Normal University. (in Chinese)
Yang F, Xu J G, Zhou L. 2016. Cluster identification and spatial characteristics of catering in Guangzhou based on DBSCAN spatial clustering.
Yang Q Y. 2008. Research on the development of tourist city. PhD diss., Tianjin University. (in Chinese)
Yang Y, Wong K K F, Wang T K. 2012. How do hotels choose their location? Evidence from hotels in Beijing.
Yu G Q. 2019. Blue book of catering industry: Annual report on catering industry development of
Zeng X, Cui H S, Liu Y H. 2018. Analysis on spatial distribution characteristics of restaurant based on network spatial point model.
Zhang J J. 2014. Research on spatial layout of catering in small-medium cities — A case study of Qingyang city. Master diss., Lanzhou University. (in Chinese)
Zhang Y, Li Q. 2019. The spatial characteristics of catering industry and its coupling analysis with dynamic population in the main city of Wuhan.
Zhang Y Z. 2018. Spatial distribution characteristics of commercial facilities in Zhengzhou based on multi-source POI data. Master diss., Zhengzhou University. (in Chinese)
Zhang Z H. 2016. A research on the spatial pattern of catering industry in China. Master diss., Lanzhou University. (in Chinese)
Zheng X G. 2009. The empirical studies of catering enterprise cluster evolution mechanism. PhD diss., Southwest Jiaotong University. (in Chinese)
Zhou A H, Zhang Y S, Fu X
Zhou S H, Hao X H, Liu L. 2014. Validation of spatial decay law caused by urban commercial center’s mutual attraction in polycentric city: Spatio-temporal data mining of floating cars’ GPS data in Shenzhen.
Zhou S Y, Zuo Y O, Wu Q. 2008. A modeling of KFC’s spatial diffusion in Beijing City.
References
[1] Cai XJ, Wu ZF, ChengJ. Using kernel density estimation to assess the spatial pattern of road density and its impact on landscape fragmentation. International Journal of Geographical Information Science, 27, 222-230(2013).
[2] ChenP, Yang XX, Du MT. A study on the spatial distribution of China National Eco-Tourism Demonstration Area. Ecological Economy, 34, 132-136(2018).
[3] Chen WS, LiuL, Liang YT. Retail center recognition and spatial aggregating feature analysis of retail formats in Guangzhou based on POI data. Geographical Research, 35, 703-716(2016).
[4] Cheng YY. Spatial structure and influencing factors of catering industry of Chengdu. Master diss., Southwest Jiaotong University(2017).
[6] CongL, Wu BH, KouX. Research on spatial distribution of convention industry in Beijing. Economic Geography, 33, 77-83(2013).
[7] DongZ. Research on Chengdu food consumption status. Master diss., Southwestern University of Finance and Economics(2008).
[9] Fang JW. The distribution characteristics and clustering mechanism of Korean catering service in Wudaokou District, Beijing. Economic Geography, 34, 106-113(2014).
[10] GuoP, Dong SC, Li ZH et al. Research on spatial distribution and international cooperation model of tourism industry in Silk Road. Resources Science, 36, 2459-2467(2014).
[11] Guo YB. Hohhot urban spatial pattern of catering industry and the influence factors of research. Master diss., Inner Mongolia Normal University(2014).
[12] Hao FL, Wang SJ, Feng ZX et al. Spatial pattern and its industrial distribution of commercial space in Changchun based on POI data. Geographical Research, 37, 366-378(2018).
[13] Hu ZY, Zhang ZG. An analysis about the spacial distribution of hotels in urban area — Taking natural city as a case. Economic Geography, 22, 106-110(2002).
[14] JinH, Xu LJ, Li YT et al. Distribution characteristics of specialty snack outlets in Beijing downtown area — Taking Shaxian snacks and Chengdu snack outlets as examples. Journal of Beijing Union University, 32, 11-35(2018).
[15] LanT, YuM, Xu ZB et al. Temporal and spatial variation characteristics of catering facilities based on POI data: A case study within 5th Ring Road in Beijing. Procedia Computer Science,, 131, 1260-1268(2018).
[16] Lei JR. The spatial diffusion and mechanism of multinational chain catering enterprises—A case study of McDonald’s and Kentucky Fried Chicken Restaurants in Fuzhou, China. Master diss., Fujian Normal Universty(2016).
[19] Li QX, Wang LC, QiaoJ et al. “Object·image, economic·feelings” research on catering spatial pattern by newdata — Take Lanzhou as an example. Economic Geography, 38, 126-135(2018).
[20] LiangL. The distribution in space of urban catering and its factors: Xi’an as an example. Journal of Northwest University (Natural Science Edition), 37, 925-930(2007).
[21] LiuJ, Li YY, LinC et al. Spatial pattern of the tourism researces of Yangze River Tourism Belt. Resources and Environment in the Yangtze Basin, 25, 1009-1015(2016).
[22] Liu XJ. Visualizing urban gastronomy in China. Environment and Planning A, 46, 1012-1013(2014).
[23] Liu YF. 2006..

Set citation alerts for the article
Please enter your email address
© Copyright 2018-2021 | Chinese Laser Press. All Rights Reserved 沪ICP备15018463号-20