
Tadao Nagatsuma, Hiroki Nishii, and Toshiyuki Ikeo. Terahertz imaging based on optical coherence tomography [Invited][J]. Photonics Research, 2014, 2(4): B64
- Photonics Research
- Vol. 2, Issue 4, B64 (2014)
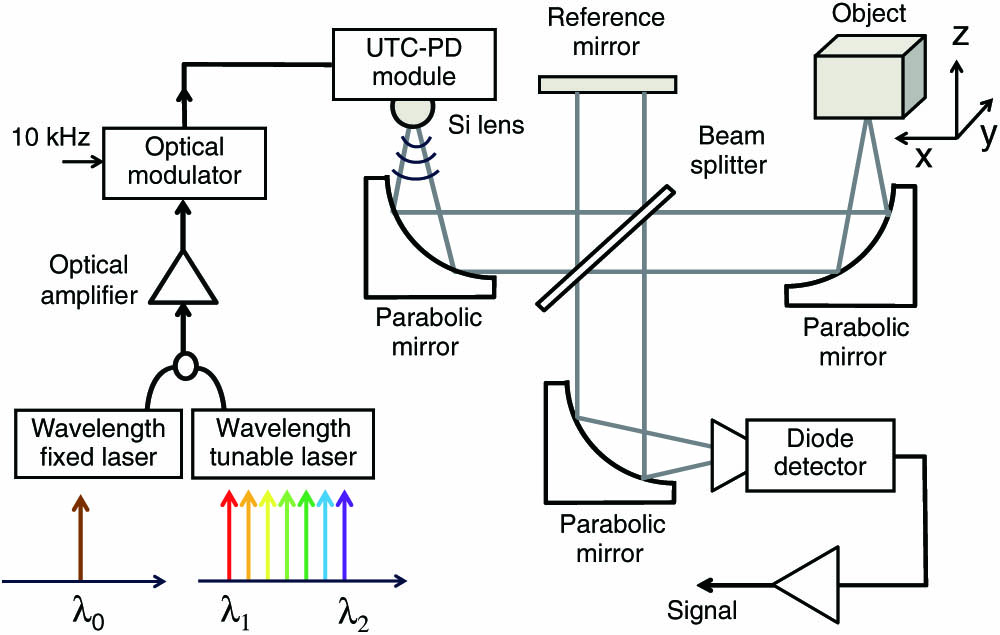
Fig. 1. Block diagram of the THz SS-OCT system.
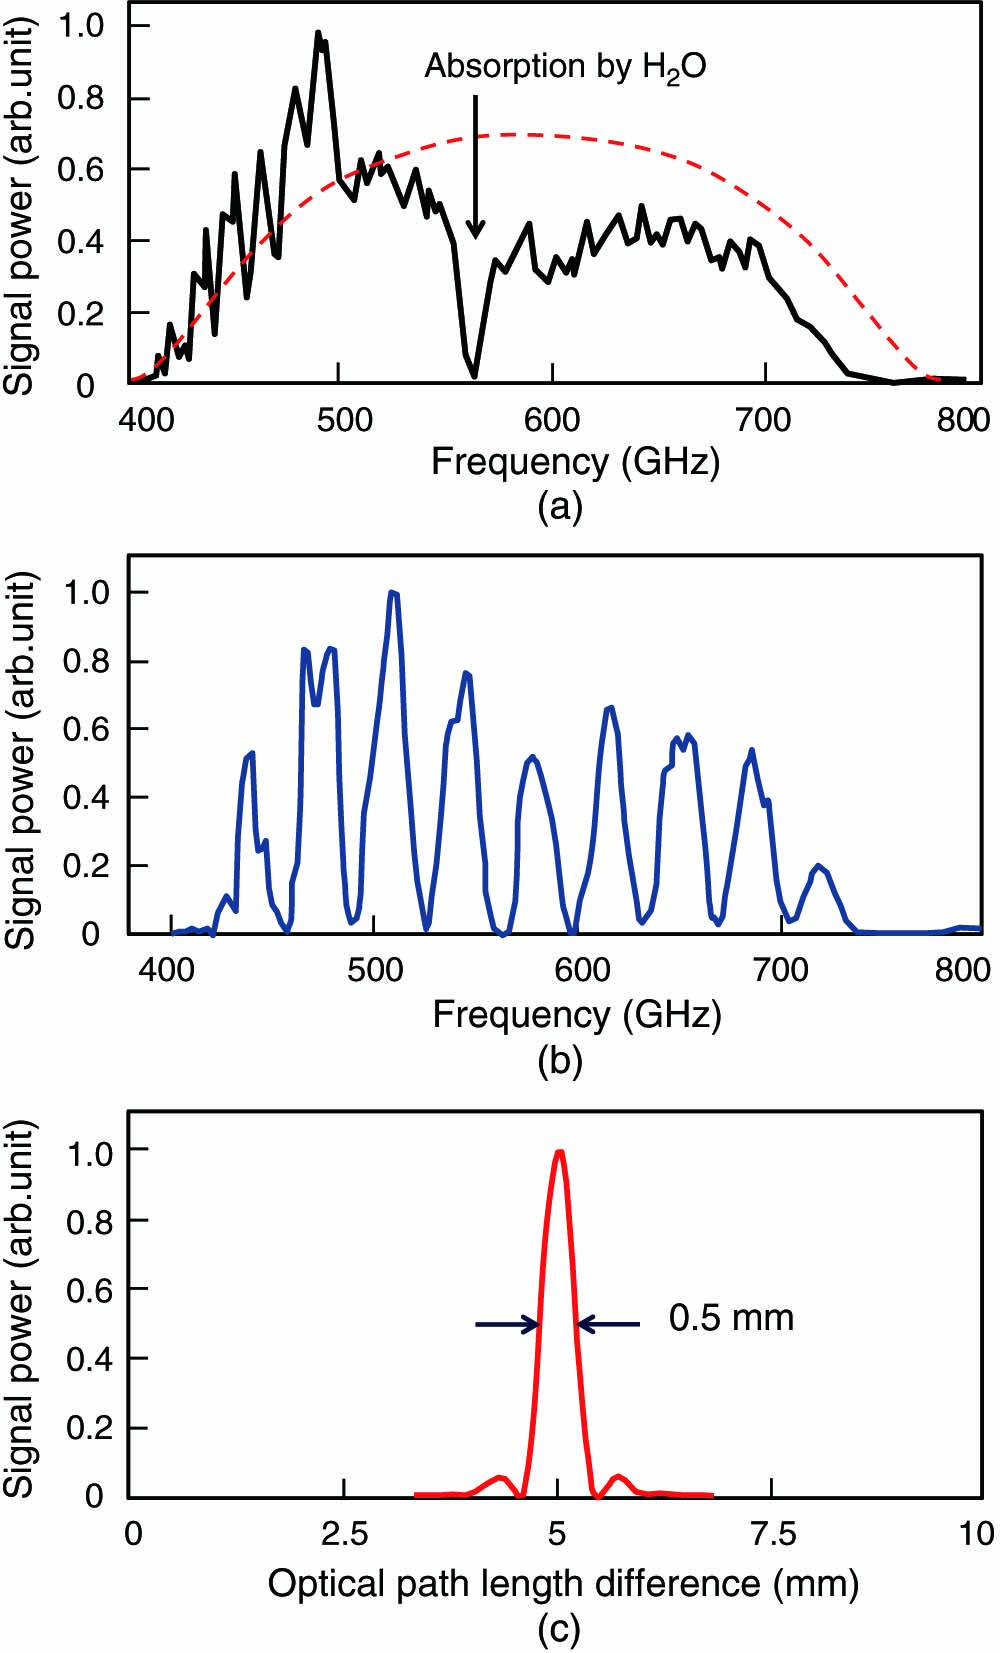
Fig. 2. (a) Frequency spectrum of detected signal power (solid line) detected by the SBD detector at 600 GHz band. Dotted line shows calculated reflection characteristic of the beam splitter used in the experiment. (b) Interference signal with plane mirror as an object. (c) Point spread function of (b).
Fig. 3. Repetitive measurement of peak distance performed for the same mirror position.
Fig. 4. (a) Object under test to evaluate the depth resolution of the system. Point spread function for the plastic plate with thickness of (b) 0.5 and (c) 0.37 mm. (d) Relationship between peak distance and actual thickness of plastic plate, t
Fig. 5. (a) Plastic bottle half-filled with water. (b) Point spread function for measured point A. (c) Point spread function for measured point B.
Fig. 6. (a) Structure of a USB cable; (b) cross-sectional image; (c) point spread function along with the dashed line in (b).
Fig. 7. (a) Block diagram of frequency-multiplier-based THz signal generation at frequencies from 400 to 780 GHz. (b) Frequency characteristics of the output power from frequency-multiplier-based and photonics-based Block diagram of frequency-multiplier-based THz signal generation at frequencies from 400 to 780 GHz.
Fig. 8. (a) Frequency spectrum of signal power (solid line) detected by the SBD detector at the 600 GHz band. Dotted line shows calculated reflection characteristics of the beam splitter used in the experiment. (b) Point spread function for the plastic plate with thickness of 0.57 mm.
Fig. 9. Block diagram of THz SS-OCT system using a frequency-multiplier-based THz source and beam scanner.
Fig. 10. (a) Photo of driver’s license card to be measured. (b), (d) Internal structure of the card consisting of electronic components made of metals. (c) Cross-sectional images taken for each line indicated in (b). (e) Planar image taken for the dotted-line area with the THz-OCT system (0.4 mm under the top surface).
| ||||||||||||||||||||||||||||
Table 1. Comparison of THz 3D or Tomographic Imaging Techniques

Set citation alerts for the article
Please enter your email address
© Copyright 2018-2021 | Chinese Laser Press. All Rights Reserved 沪ICP备15018463号-20