Abstract
Three-dimensional (3D) terahertz (THz) imaging or THz tomography has recently proven to be useful for nondestructive testing of industrial materials and structures. In place of previous imaging techniques such as THz pulsed/continuous-wave radar and THz computed tomography, we propose a THz optical coherence tomography using photonics- and electronics-based THz sources, and demonstrate thickness measurement and tomographic imaging in frequency regions from 400 to 800 GHz.1. INTRODUCTION
There exist various techniques for nondestructive and noncontact imaging using electromagnetic waves such as microwaves, infrared lights, X rays, etc. Terahertz (THz) waves, defined as electromagnetic waves ranging from 100 GHz to 10 THz, have been employed extensively in imaging applications where conventional electromagnetic waves are not effective. In particular, three-dimensional (3D) THz imaging or THz tomography has attracted a great deal of interest in various fields, such as medicine, pharmacy, security, and other industrial applications [1–3].
Table 1 shows a comparison of several THz tomographic imaging techniques. The THz signal sources used for the tomographic imaging are categorized into pulse wave and continuous wave (CW) signals. The most widely used system is based on THz pulse waves, and is sometimes referred to as THz time-of-flight, or pulse radar [2–5]. The THz pulse is incident to the object under test, and 3D images are obtained by observing the amplitude and timing of THz pulses reflected from the object. Although THz time-of-flight has proven to be a powerful inspection technique, particularly for a depth resolution of less than 0.1 mm, its drawbacks are system size, cost, and complexity, stemming from the use of femtosecond pulse lasers and other components needed for data acquisition.
| Source | Pulse | Pulse/CW | CW |
|---|
| Method | THz time-of-flight [2–5] | THz-CT [6,7] | FMCW radar [9–11] | THz-OCT (this work) [13,15,16] |
| Merits | Excellent depth resolution | Proven for microwave and X-ray | Proven for microwave and millimeter wave | Simple system configuration |
| Spectroscopy possible | Small and low-cost optical source |
| Proven for microwave | Proven for infrared light |
| Issues | Costly laser required | Object rotation required | Costly RF components required | Higher depth resolution required |
| Complicated signal processing required | |
| Long acquisition time | Higher depth resolution required |
Table 1. Comparison of THz 3D or Tomographic Imaging Techniques
The second technique for tomographic imaging is based on computed tomography (CT), which uses pulse or CW [6,7]. The object is mounted on a rotation stage, and 3D images can be obtained by rotating the object and applying signal processing to the angle-dependent signals transmitted through the object. The THz pulse-based CT system obtains not only the internal structure of the object, but also its spectroscopic information [8]. However, the rotation of projection angles requires a long measurement time, in particular for complicated and/or large objects.
Sign up for Photonics Research TOC. Get the latest issue of Photonics Research delivered right to you!Sign up now
The third technique is CW THz radar, using frequency-modulated CW (FMCW) [9–11]. The THz FMCW radar has been studied for use in standoff imaging of concealed weapons under clothes at distances from 4 to 25 m. The depth resolution is determined by the swept frequency range, and it is typically from 5 mm to 1 cm.
As the fourth technique, we have proposed the use of optical coherence tomography (OCT) techniques, which have been established for infrared imaging [12] in THz regions, in order to solve the problems of the first three techniques. We have developed a THz tomography system based on a time-domain (TD) OCT technique using a low-coherence THz CW signal, which is generated by injecting the amplified spontaneous emission noise from the optical amplifier into the photodiode (PD) [13,14] at 300 GHz bands. Depth information can be obtained by mechanically moving the reference mirror in the interferometer. We have extended the TD-OCT to “frequency-domain” or swept-source (SS) OCT techniques [15]. The SS-OCT in the infrared region acquires depth information by sweeping the frequency of infrared light sources. This eliminates the need for a translation stage for the movable mirror, contributing to a reduction not only in the system size but also in the acquisition time. In our THz SS-OCT system, we generate frequency-swept THz signals using a high-power unitraveling-carrier (UTC) PD excited by frequency-swept light sources at 300 GHz bands. We can reduce the measurement time by half compared to the TD-OCT, while maintaining the depth resolution with the same UTC-PD [15,16]. One of the issues in both TD-OCT and SS-OCT systems is that the depth resolution is , which is determined by the bandwidth of 300 GHz sources.
In this work, we aim to establish tomographic imaging systems, based on SS-OCT, applicable to diagnosis of objects with submillimeter-thick structures by improving the depth resolution using higher-frequency bands ranging from 400 to 800 GHz. After explaining the approach of our THz SS-OCT system using photonically generated THz signals, we describe system characteristics, mainly focusing on theoretical depth resolution derived from frequency characteristics. Next, we show experimentally obtained depth resolutions of the system and some results on tomographic imaging of thin-layer structures. Finally, we discuss the use of electronically generated THz signals compared with photonically generated ones.
2. SYSTEM CONFIGURATION
Figure 1 shows a block diagram of the THz SS-OCT system. It consists of a Michelson interferometer and a frequency-swept THz source. In order to generate frequency-swept THz signals, we employ a photomixing technique using two laser sources; one is a fixed light source and the other is a tunable source. These generated output signals are injected into an antenna-integrated UTC-PD module [16,17]. The frequency of the monochromatic THz signals generated by the UTC-PD is determined by the frequency difference of the two lasers, and frequency-swept THz signals are generated by changing the frequency difference. In our system, the frequency of the fixed-wavelength laser is 194.200 THz and that of the tunable laser is changed from 193.800 to 193.400 THz. Under this condition, the frequency of THz signals is swept from 400 to 800 GHz.
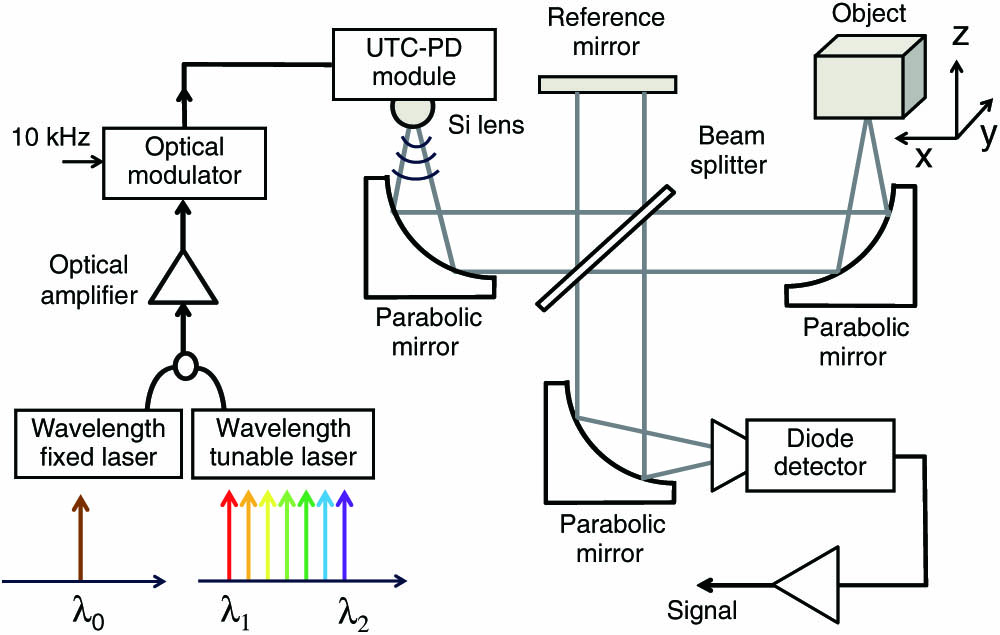
Figure 1.Block diagram of the THz SS-OCT system.
THz waves are emitted from the UTC-PD with a spherical Si lens, and collimated by a parabolic mirror. THz waves travel to a beam splitter and are divided in two directions in a ratio of 50/50. One wave goes to the reference mirror and the other is focused onto a test object by the parabolic mirror. THz waves, reflected from the reference mirror and backscattered from the test object, travel back to the beam splitter, and interference signals are detected by a Schottky barrier diode (SBD) used as a power detector. Finally, the detected signals are amplified with a preamplifier and a lock-in amplifier. An optical intensity modulator operated at 10 kHz is inserted in front of the PD to allow for lock-in detection. A personal computer is used for collecting the transferred data from the lock-in amplifier, and for controlling the components of the system. The 3D imaging is performed by fixing the object on the motorized stage and moving it in steps to the and directions, performing the so-called raster scan.
3. SYSTEM CHARACTERISTICS
Figure 2(a) shows a frequency spectrum of a detected signal power of swept THz waves which go through the Michelson interferometer without an object. Although the bandwidth of THz waves emitted from the UTC-PD ranges from 100 GHz to 2 THz, available frequency bandwidth is limited by that of SBD and by the Fabry–Perot interference effect in the beam splitter [18]. As the beam splitter, we employ 115 μm thick high resistivity float zone silicon, and the dotted line in Fig. 2(a) shows the reflection characteristic of the beam splitter; the reflectivity is zero at about 390 and 780 GHz, which is in good agreement with the obtained frequency spectrum. In addition, at 560 GHz, the signal power drops to almost zero even for 1 m transmission distance due to strong atmospheric attenuation.

Figure 2.(a) Frequency spectrum of detected signal power (solid line) detected by the SBD detector at 600 GHz band. Dotted line shows calculated reflection characteristic of the beam splitter used in the experiment. (b) Interference signal with plane mirror as an object. (c) Point spread function of (b).
In the SS-OCT, the spatial information is obtained by Fourier-transforming the frequency domain interference signals. Figure 2(b) is a spectrum of the interference signal with a plane mirror as the object, when the optical path length difference is set to 5 mm in the 600 GHz band system. After Fourier-transforming the spectrum of Fig. 2(b), the point spread function, which corresponds to the position of the object, can be calculated as shown in Fig. 2(c). The pulse-like signal has a peak at 5 mm. The full width at half-maximum (FWHM) of the pulse-like waveform of Fig. 2(c) is around 0.5 mm, which relates to the minimum depth resolved by the system, as discussed later in more detail.
In addition, Fig. 3 plots 100 data points of optical path length difference for the same position of the mirror to investigate a reproducibility of the measurement. The mean value and the standard deviation were 1.987 mm and 1.2 μm, respectively. We confirmed that all the data points were within from the mean value.
Figure 3.Repetitive measurement of peak distance performed for the same mirror position.
The theoretical depth resolution, , of the SS-OCT is given as [19] where is the center wavelength, is the FWHM of the signal, and is the refractive index of the object. Our 600 GHz band signal source of Fig. 2(a) has a center frequency of 550 GHz and FWHM of 200 GHz, corresponding to and ; thus, the theoretical depth resolution, , is 0.64 mm in the air ().
To evaluate the depth resolution experimentally, we prepared plastic plates with different thicknesses as shown in Fig. 4(a). Assuming that the reflected signals of THz waves are detected only when the refractive index of the object changes, two peaks of point spread function (corresponding to the front and back sides of the plastic plate, respectively), should be observed. Figures 4(b) and 4(c) show the point spread functions for plastic plates with thicknesses of 0.50 and 0.37 mm, respectively. The situation of Fig. 4(c) is close to the limitation for two peaks to be resolved. We define the experimental depth resolution as the minimum resolvable thickness of object or the corresponding optical path length in the air. In Fig. 4(d), we plotted peak distances for different plate thicknesses to know the refractive index of the plastic plate. The dashed line is the best fit one, assuming that . Then, the minimum resolvable depth of 0.37 mm corresponds to 0.61 mm in the air, which is in good agreement with the above theoretical value. This result also means that the effect of atmospheric absorption at 560 GHz on the resolution is negligible.
Figure 4.(a) Object under test to evaluate the depth resolution of the system. Point spread function for the plastic plate with thickness of (b) 0.5 and (c) 0.37 mm. (d) Relationship between peak distance and actual thickness of plastic plate, .
4. APPLICATIONS TO THICKNESS MEASUREMENT
To demonstrate practicality of the 600 GHz band SS-OCT system, we have performed nondestructive and noncontact measurement of certain belongings as objects with submillimeter thickness.
Figure 5(a) shows a plastic bottle filled with a liquid as an object under test. The measured point spread functions for two points A and B, without and with water inside the bottle respectively, are shown in Figs. 5(b) and 5(c). We have successfully measured the thickness of the bottle in both cases. A small change in the amplitude of reflected signals from the back side is attributed to the difference in the refractive index with and without the water inside. Assuming that the refractive index of the plastic bottle is 1.6, corresponding thicknesses are estimated as 0.51 mm for A and 0.54 mm for B. As we discussed with the accuracy of relative difference in depth, the small difference in thickness between A and B might reflect actual deviations in the thickness of the plastic bottle. In addition, the change in the amplitude of reflected signals from the back side is attributed to the difference in the refractive index with and without the water inside. The slightly larger reflection observed in case of the air inside is due to larger difference in the index of refraction between the plastic bottle and the air, compared to the case between the plastic bottle and the water. A 0.35 mm difference in the lateral position of signals for A and B is possibly due to the fact that the soft plastic object is slightly out of an upright position or is deformed.
Figure 5.(a) Plastic bottle half-filled with water. (b) Point spread function for measured point A. (c) Point spread function for measured point B.
Next, we measured the thickness of a plastic jacket for a USB cable. The structure of the cable is shown in Fig. 6(a); four conductors are covered by a metallic shield and a plastic jacket. There is an air layer between the metallic shield and the jacket. Figure 6(b) shows a cross-sectional image of the cable taken by three reflected waves at the front surface of the jacket (A), the backside of the jacket (B), and at the metallic layer (C). Figure 6(c) traces a point spread function along with the dashed line in Fig. 6(b). The measured thickness of the air layer, which corresponds to the optical path length between B and C, was 0.9 mm.
Figure 6.(a) Structure of a USB cable; (b) cross-sectional image; (c) point spread function along with the dashed line in (b).
Finally, we discuss the comparison of our technique for thickness measurement with the other one based on CW THz waves [20,21]. In that system, the change in the relative phases of photonically generated THz waves due to the object inserted can be precisely measured, which enables a thickness measurement of the object with an accuracy of several tens of micrometers. However, the demonstrated systems are only applicable to the transmission geometry in contrast to our system with the reflection geometry, and they cannot separately measure each thickness of the multilayer structure such as the case in Fig. 6.
5. ELECTRONICS-BASED APPROACH
Recently, electronics-based approaches for the generation of THz waves using frequency multipliers have proven to be useful and practical in applications to RF instruments, such as network and spectrum analyzers [22], and communications [23,24].
Figure 7(a) shows a block diagram of multiplier-based signal generation at frequencies from 400 to 780 GHz. Fundamental frequencies ranging from 22 to 43 GHz are multiplied by 18 times using a combination of one frequency doubler and two frequency triplers. Output power characteristics were measured by power meter to compare with the photonics-based approach, as shown in Fig. 7(b). The multiplier-based approach can generate higher power by more than 10 dB. There are, however, frequency cutoffs where the output power decreases to zero, mostly due to the bandwidth of each waveguide in the frequency doublers and triplers. On the contrary, the photonics-based approach with antenna-integrated PD enables more broadband generation, ensuring that the variation of the output power is within over the frequency range.
Figure 7.(a) Block diagram of frequency-multiplier-based THz signal generation at frequencies from 400 to 780 GHz. (b) Frequency characteristics of the output power from frequency-multiplier-based and photonics-based Block diagram of frequency-multiplier-based THz signal generation at frequencies from 400 to 780 GHz.
It must be mentioned that the total bandwidth of the SS-OCT system is also determined by that of the detector, which is currently a waveguide-mounted SBD detector, and the thickness-dependent bandwidth of the silicon beam splitter. As a result, a frequency spectrum of a detected signal power of swept THz waves, which go through the Michelson interferometer of Fig. 1 without an object, becomes as shown in Fig. 8(a). Compared to that of the photonics-based system in Fig. 2(a), a center frequency is moved to 623 GHz with FWHM of 156 GHz, given that the theoretical depth resolution, , is 0.84 mm in the air (). This value is slightly larger than that of photonics-based system. We have conducted a thickness measurement of the plastic plate with the same procedure of Fig. 4. Figure 8(b) shows a point spread function for the plastic plate with thickness of 0.57 mm. This corresponds to the peak distance of 0.88 mm, which is close to the previously discussed theoretical depth resolution of the system.
Figure 8.(a) Frequency spectrum of signal power (solid line) detected by the SBD detector at the 600 GHz band. Dotted line shows calculated reflection characteristics of the beam splitter used in the experiment. (b) Point spread function for the plastic plate with thickness of 0.57 mm.
Although the depth resolution of the electronics-based system is worse to a small extent, we extended the SS-OCT system of Fig. 1 to a more practical one, as shown in Fig. 9, to take advantage of the higher output power emitted from the frequency multiplier. In the photonics-based system, we used several sets of off-axis parabolic mirrors made of Au-coated metals in order not to lose the power of emitted THz waves from the PD. The use of such metallic mirrors usually makes it difficult to perform THz beam alignment, particularly to construct a Michelson interferometer, compared to convex lenses made of dielectric materials such as Teflon. In Fig. 9, we employed a single convex Teflon lens to collimate THz beams emitted from a horn antenna of the multiplier. In addition, we introduced an lens together with a single rotation mirror in order to perform a one-dimensional (1D) beam scanning. The lens consists of two aspheric Teflon lenses. Detailed design and performance of the THz beam scanner will be reported elsewhere.
Figure 9.Block diagram of THz SS-OCT system using a frequency-multiplier-based THz source and beam scanner.
Figure 10 shows an application of the above system to tomographic imaging of a driver’s license card with a thickness of about 0.8 mm. Photos of the card and internal structure of the card are shown in Figs. 10(a) and 10(b), respectively. Cross-sectional images were taken as shown in Fig. 10(c) for each line indicated in Fig. 10(b). The scanned planar image, which is 0.4 mm under the top surface, is shown in Fig. 10(e). THz waves were reflected off by metallic components in the card. It took about 20 min to obtain 4500 voxels.
Figure 10.(a) Photo of driver’s license card to be measured. (b), (d) Internal structure of the card consisting of electronic components made of metals. (c) Cross-sectional images taken for each line indicated in (b). (e) Planar image taken for the dotted-line area with the THz-OCT system (0.4 mm under the top surface).
6. CONCLUSION
Noncontact THz tomography techniques, which are capable of cross-sectional imaging, have recently attracted much interest for use in various fields such as medical, pharmaceutical, security, and others requiring nondestructive inspection. In this work, we have described tomographic imaging systems based on SS-OCT applicable to the diagnosis of thin-layer structures with submillimeter resolution using higher-frequency bands ranging from 400 to 800 GHz.
First, we have demonstrated the use of photonics-based sources in the THz SS-OCT system, and experimentally confirmed a depth resolution of 0.61 mm in the air, with a measurement repeatability of . We have also successfully applied the system to real-life applications such as thickness measurement of a water-filled plastic bottle and internal structures of a USB cable. Next, we have examined the use of electronics-based sources using frequency multipliers in the THz SS-OCT system, and experimentally confirmed a submillimeter depth resolution. The advantage of the electronics-based source is higher output power, which is larger than that of the photonics-based approach, while the photonics-based source offers broader bandwidth. Currently, the bandwidth of the detector is a dominant factor to determine that of the photonics-based SS-OCT system. Finally, we have introduced a 1D beam scanner in the electronics-based system, and successfully demonstrated a tomographic imaging of an integrated circuit (IC) card.
In a future work, we plan to perform a real-time measurement by introducing a 2D beam-scanning system. A photonics-based broadband receiver together with the photonics-based source should enhance not only the depth resolution but also the sensitivity and/or dynamic range of the THz SS-OCT system.
References
[1] B. B. Hu, M. C. Nuss. Imaging with terahertz waves. Opt. Lett., 20, 1716-1718(1995).
[2] W. L. Chan, J. Deibel, D. M. Mittleman. Imaging with terahertz radiation. Rep. Prog. Phys., 70, 1325-1379(2007).
[3] K. Ajito, Y. Ueno. THz chemical imaging for biological applications. IEEE Trans. Terahertz Sci. Technol., 1, 293-300(2011).
[4] A. J. Fitzgerald, B. E. Cole, P. F. Taday. Nondestructive analysis of tablet coating thickness using terahertz pulsed imaging. J. Pharm. Sci., 94, 177-183(2005).
[5] J. Takayanagi, H. Jinno, S. Ichino, K. Suizu, M. Yamashita, T. Ouchi, S. Kasai, H. Ohtake, H. Uchida, N. Nishizawa, K. Kawase. High-resolution time-of-flight terahertz tomography using a femtosecond fiber laser. Opt. Express, 17, 7533-7539(2009).
[6] X.-X. Yin, B. W.-H. Ng, B. Ferguson, S. P. Mickan, D. Abbott. 2-D wavelet segmentation in 3-D T-ray tomography. IEEE Sens. J., 7, 342-343(2007).
[7] B. Recur, A. Younus, S. Salort, P. Mounaix, B. Chassagne, P. Desbarats, J.-P. Caumes, E. Abraham. Investigation on reconstruction methods applied to 3D terahertz computed tomography. Opt. Express, 19, 5105-5117(2011).
[8] M. Imamura, S. Nishina, A. Irisawa, T. Yamashita, E. Kato. 3D imaging and analysis system using terahertz waves. International Conference on Infrared Millimeter and Terahertz Waves, We-B3.1(2010).
[9] H. Quast, T. Loeffler. 3D-terahertz-tomography for material inspection and security. International Conference on Infrared Millimeter and Terahertz Waves, T3D02.0311(2009).
[10] H. Quast, A. Keil, T. Hoyer, T. Loeffler. All-electronic 3D terahertz imaging for the NDT of composites. Proceedings of the 2nd International Symposium on NDT in Aerospace, We.4.B.3(2010).
[11] K. B. Cooper, R. J. Dengler, N. Llombart, T. Bryllent, G. Chattopadhyay, E. Schlecht, J. Gill, C. Lee, A. Skalare, I. Mehdi, P. H. Siegel. Penetrating 3-D imaging at 4- and 25-m range using a submillimeter-wave radar. IEEE Trans. Microwave Theor. Tech., 56, 2771-2778(2008).
[12] D. Huang, E. A. Swanson, C. P. Lin, J. S. Schuman, W. G. Stinson, W. Chang, M. R. Hee, T. Flotte, K. Gregory, C. A. Puliafito, J. G. Fujimoto. Optical coherence tomography. Science, 254, 1178-1181(1991).
[13] T. Isogawa, T. Kumashiro, H.-J. Song, K. Ajito, N. Kukutsu, K. Iwatsuki, T. Nagatsuma. Tomographic imaging using photonically generated low-coherence terahertz noise sources. IEEE. Trans. Terahertz Sci. Technol., 2, 485-492(2012).
[14] T. Nagatsuma, T. Kumashiro, Y. Fujimoto, K. Taniguchi, K. Ajito, N. Kukutsu, T. Furuta, A. Wakatsuki, Y. Kado. Millimeter-wave imaging using photonics-based noise source. International Conference on Infrared Millimeter and Terahertz Waves, M3C05(2009).
[15] T. Ikeou, T. Isogawa, K. Ajito, N. Kukutsu, T. Nagatsuma. Terahertz imaging using swept source optical-coherence-tomography techniques. International Topical Meeting on Microwave Photonics, 8-4(2012).
[16] T. Nagatsuma, T. Ikeo, H. Nishii. Terahertz imaging based on optical coherence tomography. 21st International Conference on Applied Electromagnetics and Communications(2013).
[17] T. Nagatsuma, G. F. Dalla Betta, H. Ito. High-power RF uni-traveling-carrier photodiodes (UTC-PDs) and their applications. Advances in Photodiodes(2011).
[18] T. Ishibashi, Y. Muramoto, T. Yoshimatsu, H. Ito. Continuous THz wave generation by photodiodes up to 2.5 THz. International Conference on Infrared Millimeter and Terahertz Waves, We2-5(2013).
[19] S. H. Yun, G. J. Tearney, J. F. de Boer, N. Iftimia, B. E. Bouma. High-speed optical frequency-domain imaging. Opt. Express, 11, 2953-2963(2003).
[20] H.-C. Ryu, N. Kim, S.-P. Han, H. Ko, J.-W. Park, K. Moon, K. H. Park. Simple and cost-effective thickness measurement terahertz system based on a compact 1.55 μm λ/4 phase-shifted dual-mode laser. Opt. Express, 20, 25990-25999(2012).
[21] S. Hisatake, G. Kitahara, N. Kukutsu, Y. Fukada, N. Yoshimoto, T. Nagatsuma. Phase-sensitive terahertz self-heterodyne system based on photodiode and low-temperature grown GaAs photoconductor at 1.55 μm. IEEE Sens. J., 13, 31-36(2013).
[22]
[23] L. Moeller, J. F. Federici, K. Su. THz wireless communications: 2.5 Gb/s error-free transmission at 625 GHz using a narrow-bandwidth 1 mW THz source. URSI General Assembly and Scientific Symposium, DAF2–7(2011).
[24] T. Nagatsuma, S. Horiguchi, Y. Minamikata, Y. Yoshimizu, S. Hisatake, S. Kuwano, N. Yoshimoto, J. Terada, H. Takahashi. Terahertz communications based on photonics technologies. Opt. Express, 21, 23736-23748(2013).

