
Tian-Hong Lian, Shi-Yu Wang, Ke Kou, Yun Liu. Off-axis pumped Hermite-Gaussian mode solid-state laser [J]. Acta Physica Sinica, 2020, 69(11): 114202-1
- Acta Physica Sinica
- Vol. 69, Issue 11, 114202-1 (2020)
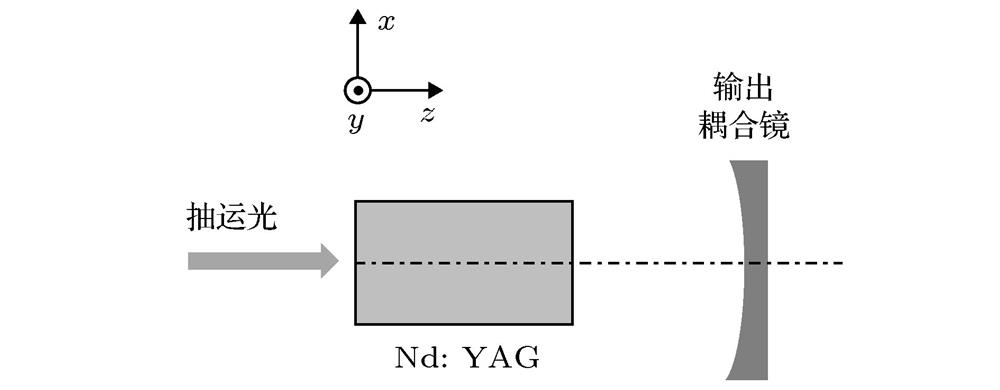
Fig. 1. Schematic of an off-axis end-pumped solid-state laser.
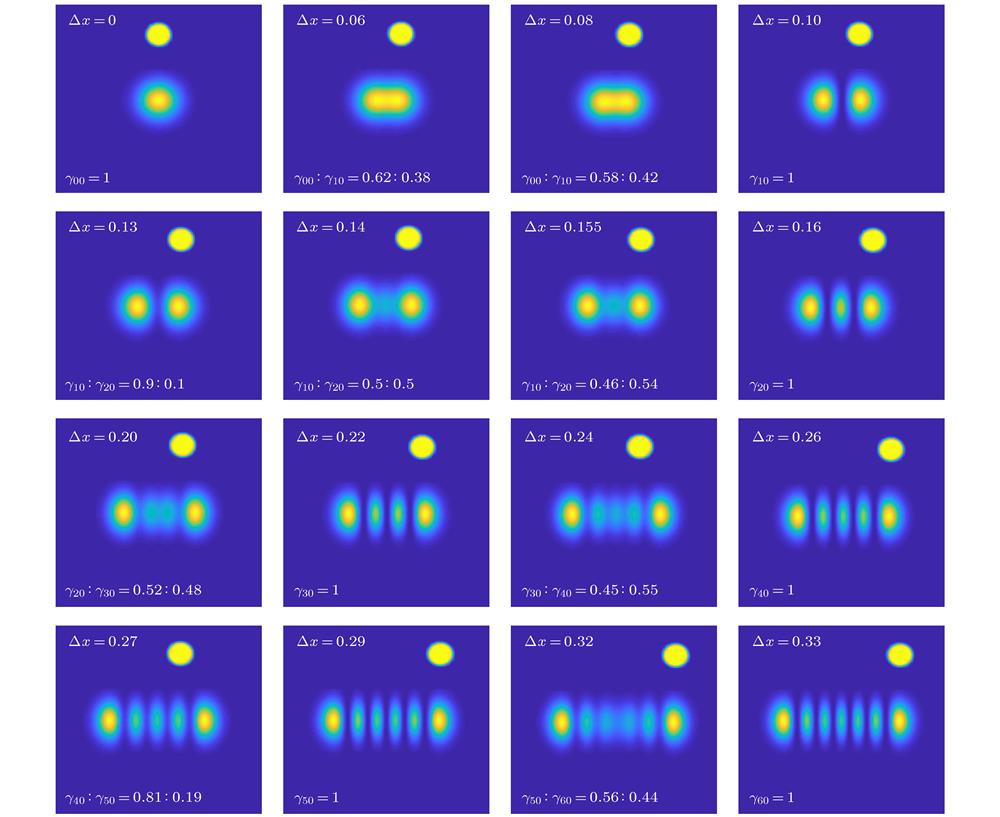
Fig. 2. Laser beam profiles with different mode distributions in the sixteen transverse displacements when the pump power is 0.25 W and the pump beam radius is 0.075 mm.
Fig. 3. Photon numbers of the mode HG00 and HG10 (a), and their percentages (b); photon numbers of the modes HG10 and HG20 (c), and their percentages (d) near the threshold.
Fig. 4. Dependence of the net gains on the pump power: (a) 0.08 mm; (b) 0.155 mm.
Fig. 5. Laser beam profiles with different mode distributions in the eight transverse displacements when the pump power is 0.5 W and the pump beam radius is 0.15 mm.
Fig. 6. Photon numbers of the modes HG00 , HG10 and HG20 (a) and their percentages (b); photon numbers of the modes HG10, HG20 and HG30 ((c), (e)) and their percentages ((d), (f)) near the threshold.
Fig. 7. Dependence of the net gains on the pump power: (a) 0.1 mm; (b) 0.2 mm.
Fig. 8. Dynamics of the photon numbers: (a) ω p = 0.075 mm, Δx = 0.08 mm, P a = 0.5 W; (b) ω p = 0.075 mm, Δx = 0.08 mm, P a = 5 W; (c) ω p = 0.15 mm, Δx = 0.1 mm, P a = 0.5 W; (d) ω p = 0.15 mm, Δx = 0.1 mm, P a = 5 W; (e) ω p = 0.15 mm, Δx = 0.2 mm, P a = 0.5 W; (f) ω p = 0.15 mm, Δx = 0.2 mm, P a = 5 W.
Fig. 9. Schematic of the experimental setup.
Fig. 10. Output spots with different off-axis displacements.
Fig. 11. The spot keeps unchanged with the variation of the laser power.
Fig. 12. (a) Dependence of the output power on the displacement; (b) the maximum powers of the modes.

Set citation alerts for the article
Please enter your email address
© Copyright 2018-2021 | Chinese Laser Press. All Rights Reserved 沪ICP备15018463号-20