
An Shu, Haodong Pei, Huixian Duan. Trinocular Stereo Visual Measurement Method for Spatial Non-Cooperative Target[J]. Acta Optica Sinica, 2021, 41(6): 0615001
- Acta Optica Sinica
- Vol. 41, Issue 6, 0615001 (2021)
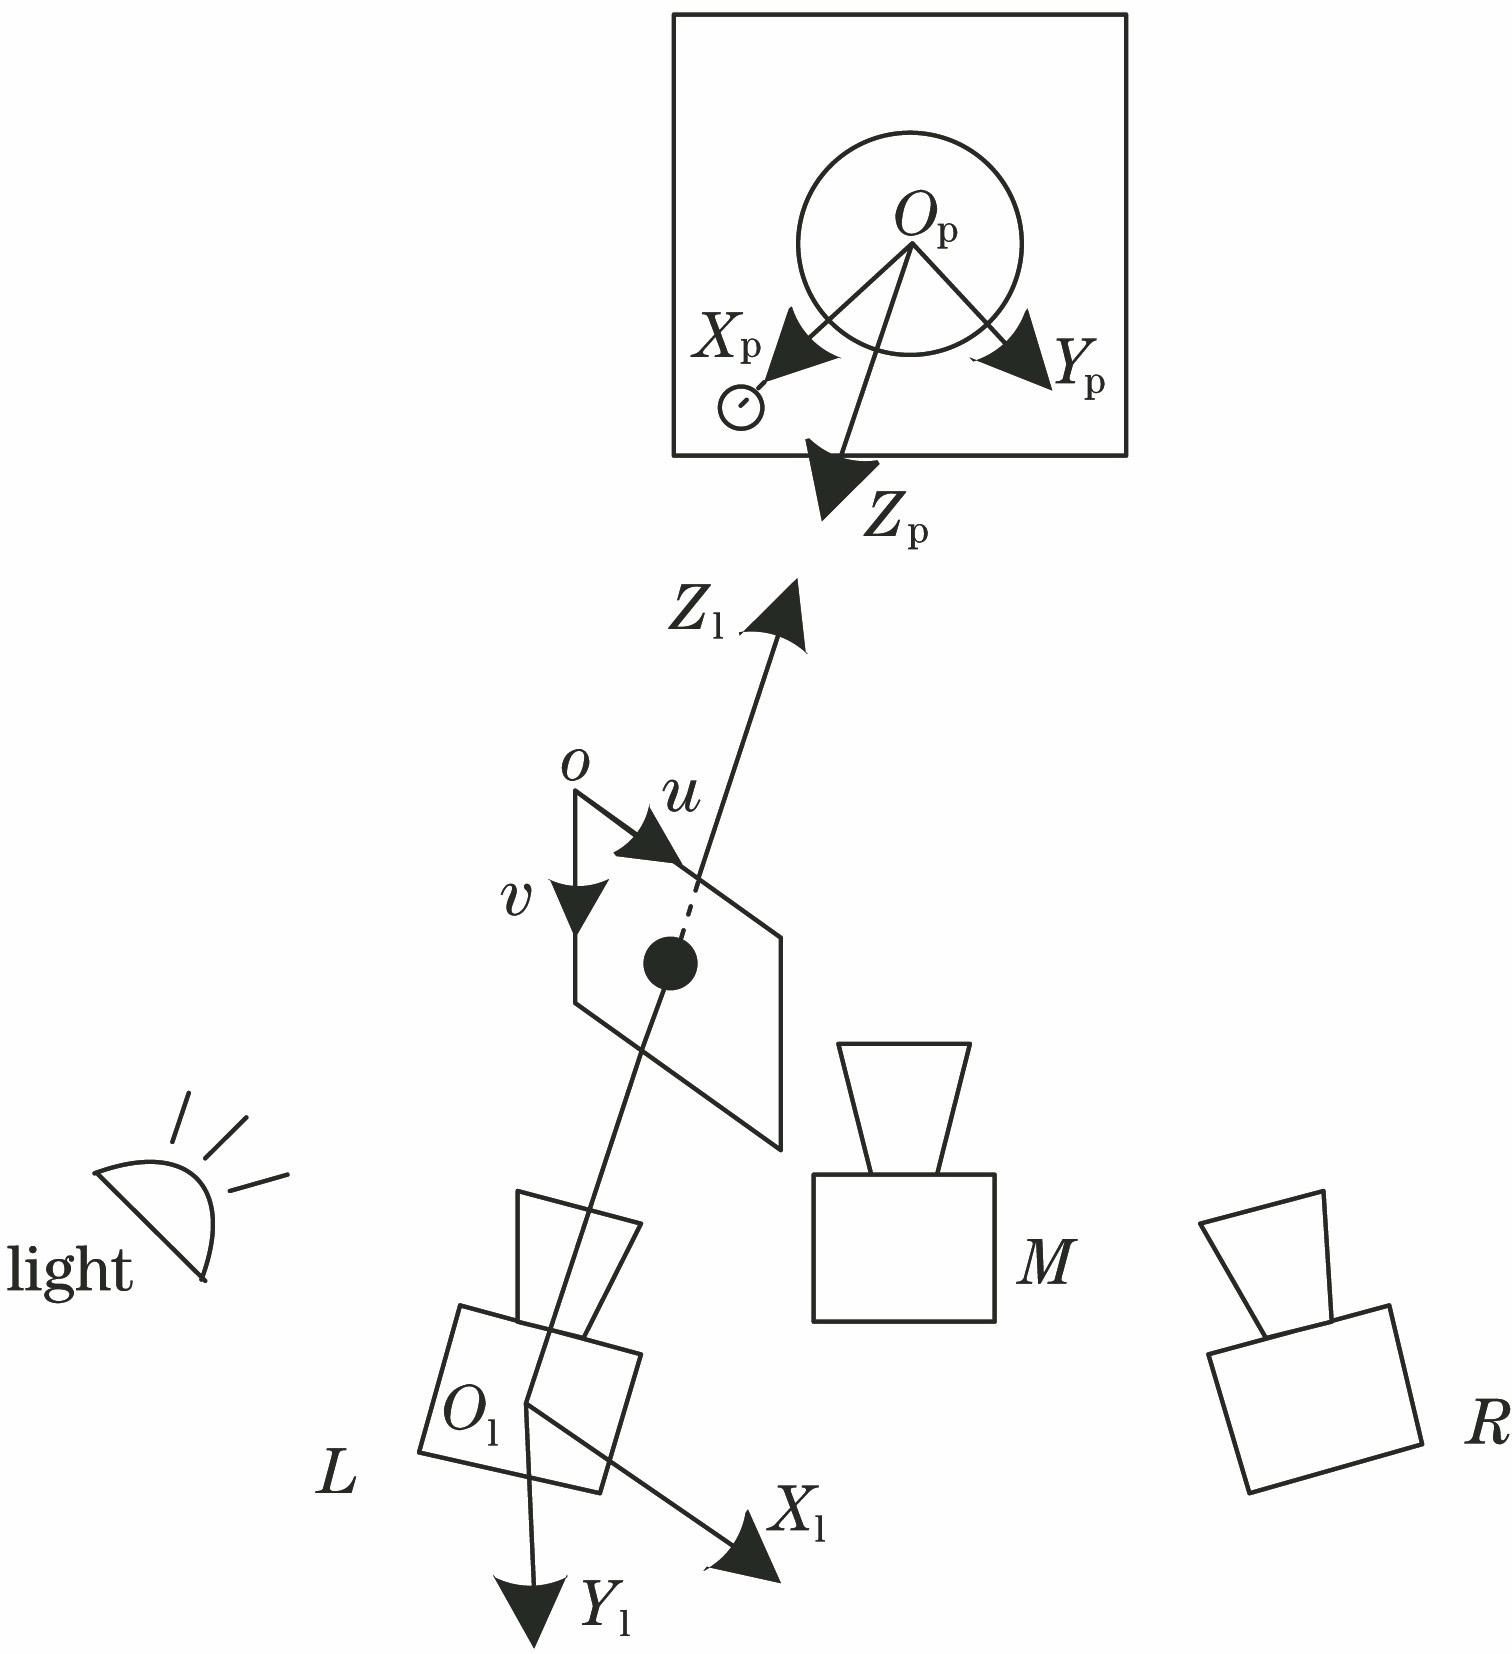
Fig. 1. Interrelation of coordinate system in trinocular vision measuring system
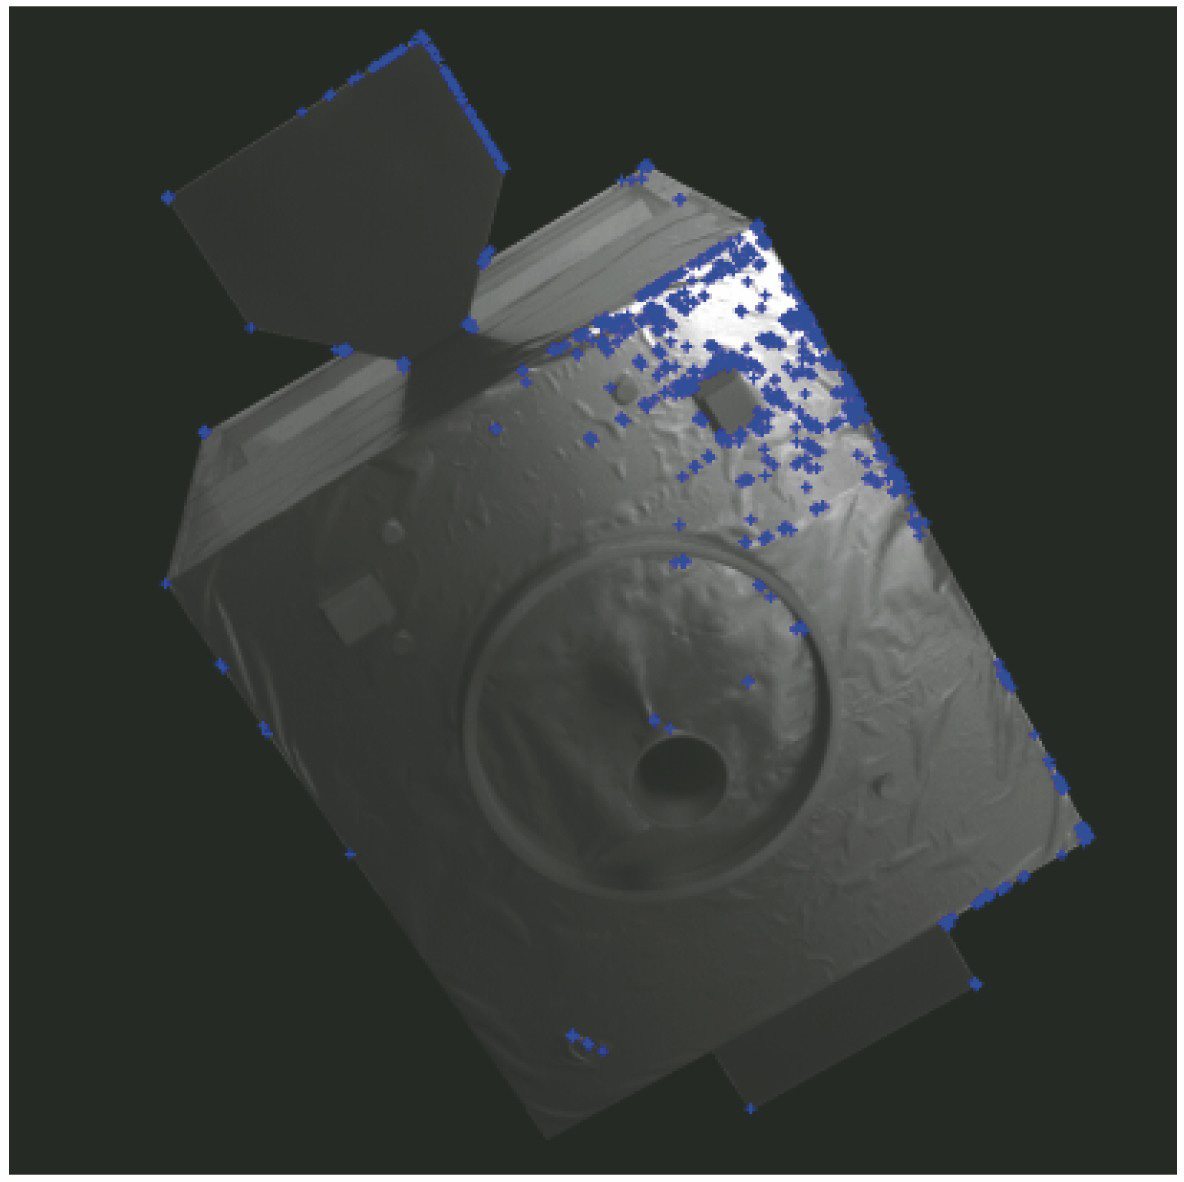
Fig. 2. Simulation diagram of non-cooperative target structure
Fig. 3. Schematic of polar constraint in triocular stereo vision system
Fig. 4. Feature point matching results of binocular stereo vision
Fig. 5. Feature point matching results of trinocular stereo vision. (a) Image Lp and image Rp; (b) image Lp and image Mp
Fig. 6. Matching results of feature points in front and back frames
Fig. 7. Installation diagram of triocular camera
Fig. 8. Experimental scene images obtained by triocular camera. (a) Image taken by camera L; (b) image taken by camera R; (c) image taken by camera M
Fig. 9. Pose curves of model under different conditions. (a) Relative position; (b) relative posture
Fig. 10. Pose variation curves of model under different conditions in dark room solar model inverse environment. (a) Relative position; (b) relative posture
|
Table 1. Measurement results of non-cooperative target model moving along X-axis of console
|
Table 2. Measurement results of non-cooperative target model moving along Y-axis of console
|
Table 3. Measurement results of non-cooperative target model moving along Z-axis of console

Set citation alerts for the article
Please enter your email address
© Copyright 2018-2021 | Chinese Laser Press. All Rights Reserved 沪ICP备15018463号-20