• High Power Laser and Particle Beams
  • Vol. 35, Issue 9, 091002 (2023)
Shanshan Wang1, Feng Shi2、*, Shuo Qiao2, Bowen Xu1, Qun Hao1、3, Ci Song2, Guipeng Tie2, Ye Tian2, Dede Zhai2, and Xing Peng2
Author Affiliations
  • 1Beijing Key Laboratory for Precision Optoelectronic Measurement Instrument and Technology, School of Optics and Photonics, Beijing Institute of Technology, Beijing 100081, China
  • 2College of Intelligence Science, National University of Defense Technology, Changsha 410073, China
  • 3School of Opto-Electronic Engineering, Changchun University of Science and Technology, Changchun 130022, China
  • show less
    DOI: 10.11884/HPLPB202335.220405 Cite this Article
    Shanshan Wang, Feng Shi, Shuo Qiao, Bowen Xu, Qun Hao, Ci Song, Guipeng Tie, Ye Tian, Dede Zhai, Xing Peng. Error-sensitive factors analysis and verification for optical element in-situ measurement device based on phase measuring deflectometry[J]. High Power Laser and Particle Beams, 2023, 35(9): 091002 Copy Citation Text show less
    Data transmission flow chart
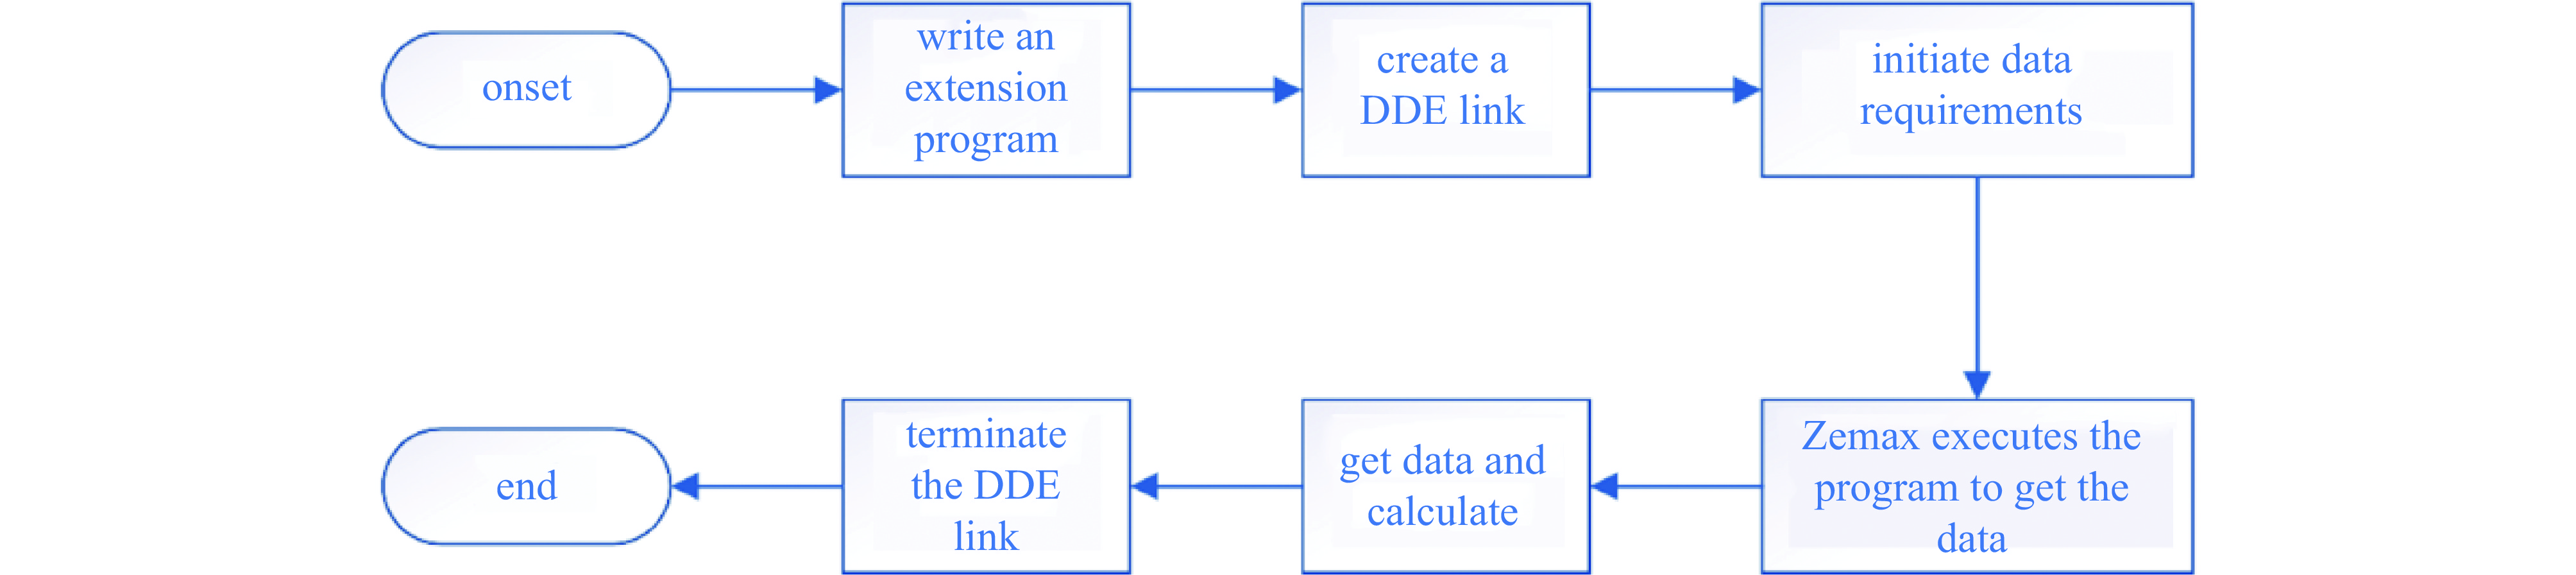
    Fig. 1. Data transmission flow chart
    Edge ray tracing of Zemax
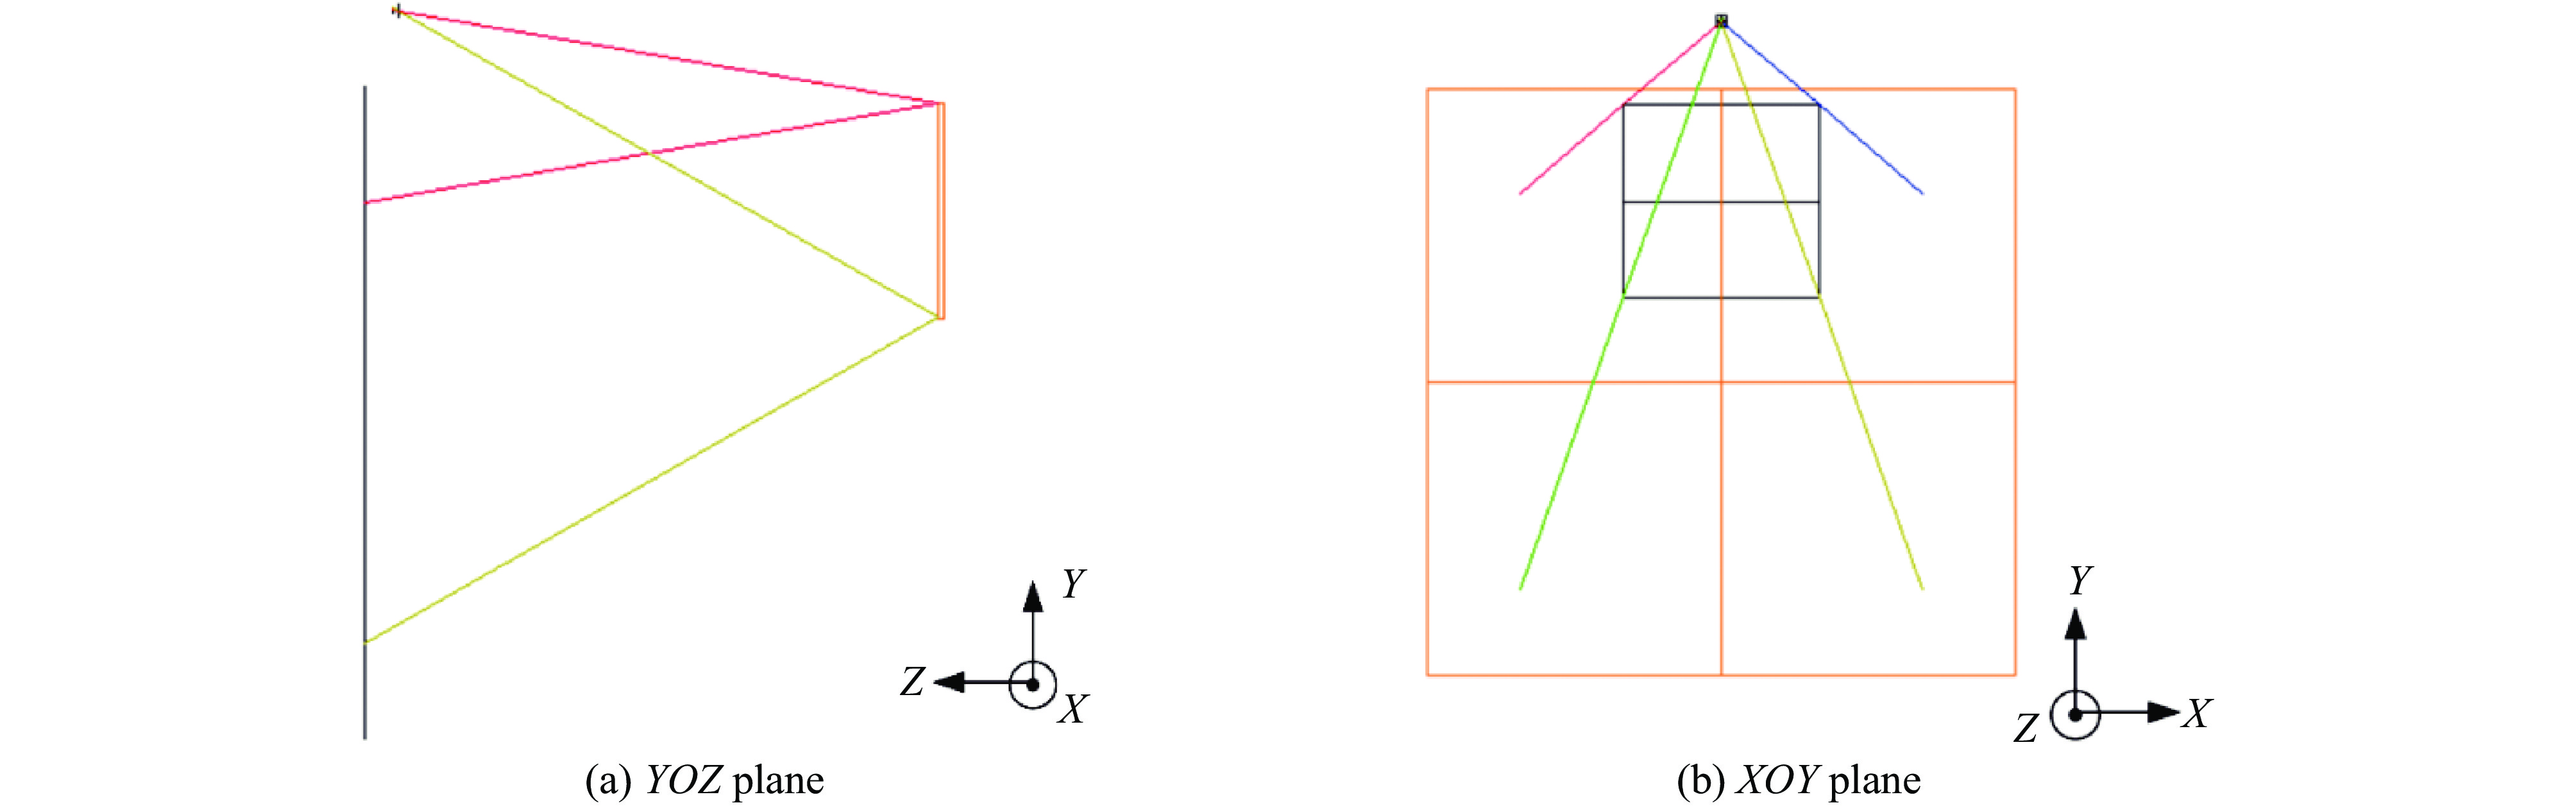
    Fig. 2. Edge ray tracing of Zemax
    Different k values correspond to the measurement surface shape error
    Fig. 3. Different k values correspond to the measurement surface shape error
    The surface shape errors corresponding to different k values
    Fig. 4. The surface shape errors corresponding to different k values
    Schematic diagram of the influence of image generator positioning error along Z axis
    Fig. 5. Schematic diagram of the influence of image generator positioning error along Z axis
    De-skewed surface shape error caused by the image generator offsetting 0.01 mm along the positive direction of Z axis
    Fig. 6. De-skewed surface shape error caused by the image generator offsetting 0.01 mm along the positive direction of Z axis
    Surface shape error caused by image generator’s offset along the Z axis direction
    Fig. 7. Surface shape error caused by image generator’s offset along the Z axis direction
    Zernike coefficients corresponding to surface shape error
    Fig. 8. Zernike coefficients corresponding to surface shape error
    Size of the surface shape error caused by the offset along the Z axis
    Fig. 9. Size of the surface shape error caused by the offset along the Z axis
    Zernike coefficients corresponding to surface shape error
    Fig. 10. Zernike coefficients corresponding to surface shape error
    Schematic diagram of the change of sampling points when k1 > 0 and k1 < 0
    Fig. 11. Schematic diagram of the change of sampling points when k1 > 0 and k1 < 0
    k1>0, slope and surface shape error caused by detector lens distortion
    Fig. 12. k1>0, slope and surface shape error caused by detector lens distortion
    Surface shape error caused by lens distortion of detector
    Fig. 13. Surface shape error caused by lens distortion of detector
    Zernike coefficients corresponding to surface shape error
    Fig. 14. Zernike coefficients corresponding to surface shape error
    In-situ detection system structure
    Fig. 15. In-situ detection system structure
    Change of measurement results with time
    Fig. 16. Change of measurement results with time
    Measurement results of surface shape error and temperature variation with time
    Fig. 17. Measurement results of surface shape error and temperature variation with time
    directionmaximum surface shape error/nmcorresponding to Zernike coefficients
    PVRMSnumber of termsnumber of main itemsmain types
    along the X axis 77.210.12、5、8、15545° primary astigmatism
    along the Y axis 88.918.13、4、6、7、94、6defocusing and 0° primary astigmatism
    along the Z axis 152.730.63、4、6、74、6defocusing and 0° primary astigmatism
    Table 1. Influence of image generator’s positioning error on the measurement results
    directionmaximum surface shape error/nmcorresponding to Zernike coefficients
    PVRMSnumber of termsnumber of main itemsmain types
    along the X axis 81.810.82、5、8、15545° primary astigmatism
    along the Y axis 94.219.13、4、6、7、94、6defocusing and 0° primary astigmatism
    along the Z axis 161.932.43、4、6、74、6defocusing and 0° primary astigmatism
    Table 2. Effect of pinhole diaphragm positioning error on measurement results
    influencing factormaximum surface shape error/nm corresponding to Zernike coefficients
    PVRMSnumber of terms number of main items main types
    detector lens distortion (|k1|=1×10⁻³) pin-cushion distortion155.324.93、4、6、11、12、284、6、11、12defocusing, 0° primary astigmatism and higher-order aberrations
    barrel distortion155.324.93、4、6、11、12、284、6、11、12defocusing, 0° primary astigmatism and higher-order aberrations
    Table 3. Effect of detector lens distortion on measurement results
    influencing factormaximum surface shape error/nmcorresponding to Zernike coefficients
    PVRMSnumber of terms number of main items main types
    image generator expansion416.985.33、4、5、6、73、4、5defocusing, 45° primary astigmatism, 0° primary astigmatism
    detector expansion99.720.43、4、6、74focusing out
    support structure expansion4.91.03、4、6、7、94、6defocusing and 0° primary astigmatism
    Table 4. Effect of temperature change on measurement results
    measurement serial numberPV/nmRMS/nmmeasurement serial numberPV/nmRMS/nm
    119.23.11646.69.6
    218.42.91746.79.6
    321.74.01847.710.0
    428.35.41949.310.3
    529.74.82044.99.3
    627.75.22142.68.8
    733.76.62245.59.5
    834.46.62343.58.7
    931.35.92441.77.3
    1034.36.62541.36.6
    1137.47.12650.19.0
    1240.58.12760.610.9
    1344.59.32845.79.0
    1448.210.02937.66.3
    1548.110.13039.97.1
    Table 5. Detection system parameters
    Shanshan Wang, Feng Shi, Shuo Qiao, Bowen Xu, Qun Hao, Ci Song, Guipeng Tie, Ye Tian, Dede Zhai, Xing Peng. Error-sensitive factors analysis and verification for optical element in-situ measurement device based on phase measuring deflectometry[J]. High Power Laser and Particle Beams, 2023, 35(9): 091002
    Download Citation