
Yuanshuai Zhang, Hongwei Zhang, Songhua Wu. Design of Water Scheimpflug Lidar Technology Used for Measuring Small Angle Backscattering[J]. Acta Optica Sinica, 2020, 40(11): 1101004
- Acta Optica Sinica
- Vol. 40, Issue 11, 1101004 (2020)
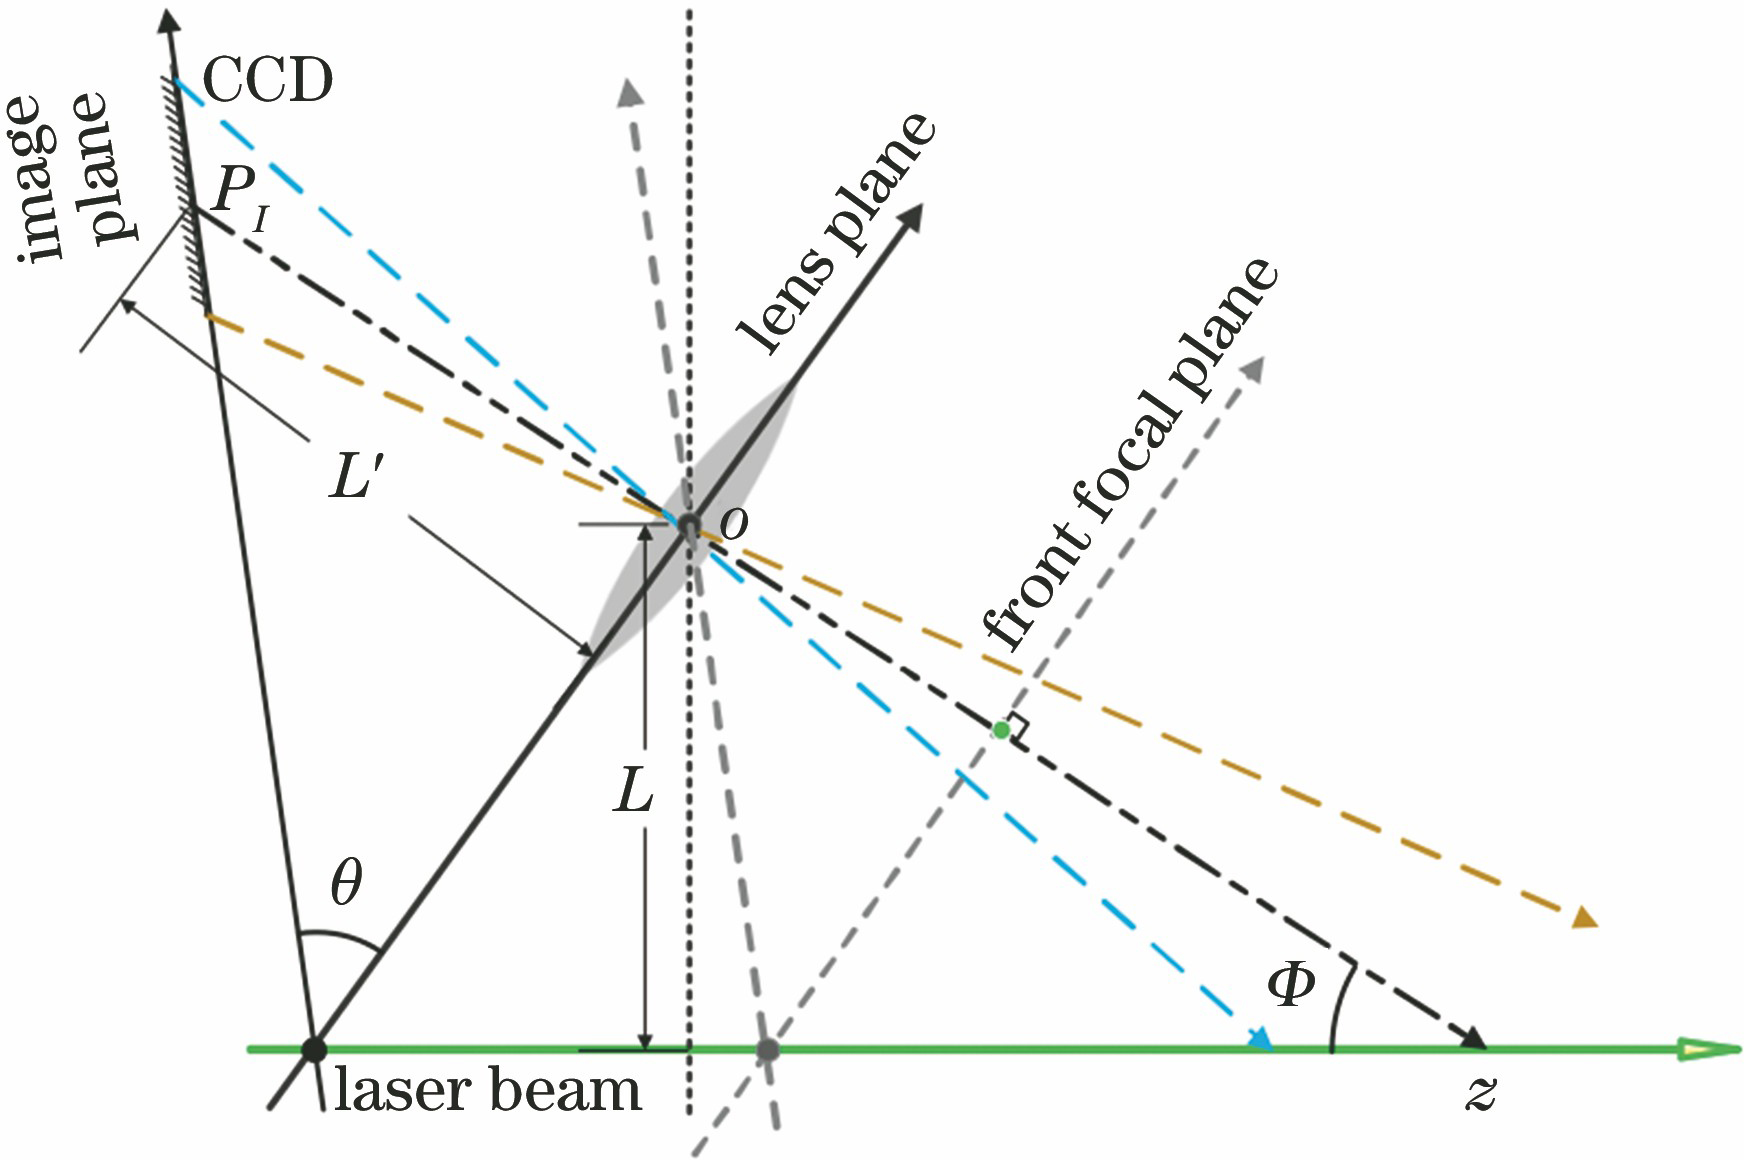
Fig. 1. Schematic of Scheimpflug imaging

Fig. 2. Relationship among measurement parameters. (a) Relationship of camera pixel points with measurement distance and distance resolution; (b) relationship of camera pixel points with backscattering angle and angle resolution
Fig. 3. Schematic of diffusion circle
Fig. 4. Relationship between depth-of-field and distance resolution of pixel points
Fig. 5. Schematic of experimental system
Fig. 6. Relationship between beam refraction and detection distance. (a) Schematic of light refraction; (b) relationship between pixel points and detection distance
Fig. 7. Intensity curves of water Scheimpflug lidar and intensity curves of backscattered light with different exposure time when tap water used as medium. (a) 1 s; (b) 5 s; (c) 10 s; (d) 14 s
Fig. 8. Scattered signal intensities of different measurement media. (a) Deionized water; (b) tap water; (c) river water
Fig. 9. Beam width diagrams obtained from three water body measurements. (a) Deionized water; (b) tap water; (c) river water
Fig. 10. Flowchart of laser beam width data processing
Fig. 11. Laser beam width and its standard deviation versus measurement distance for three different water bodies
Fig. 12. Scatter plots of initial beam width, beam width decay rate, and scattered light intensity decay rate for three different water bodies
Fig. 13. Filter membranes obtained from filtration for three different water bodies
| |||||||||||||||||||||||||||||||||||||
Table 1. Comparison of data from spectrophotometer and water Scheimpflug lidar

Set citation alerts for the article
Please enter your email address
© Copyright 2018-2021 | Chinese Laser Press. All Rights Reserved 沪ICP备15018463号-20