Author Affiliations
1Faculty of Resources and Environmental Science, Hubei University, Wuhan 430062, China2Ministry of Environmental Protection, Satellite Environment Center, Beijing 100094, China3College of Urban and Environment Science, Central China Normal University, Wuhan 430079, China4School of Remote Sensing and Information, Wuhan University, Wuhan 430062, Chinashow less
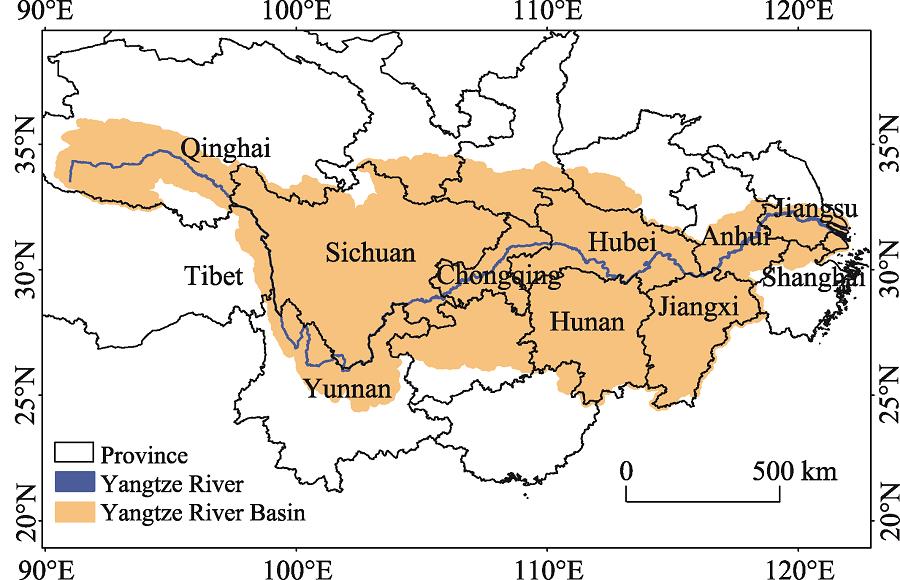
Fig. 1. Location map of the Yangtze River Basin
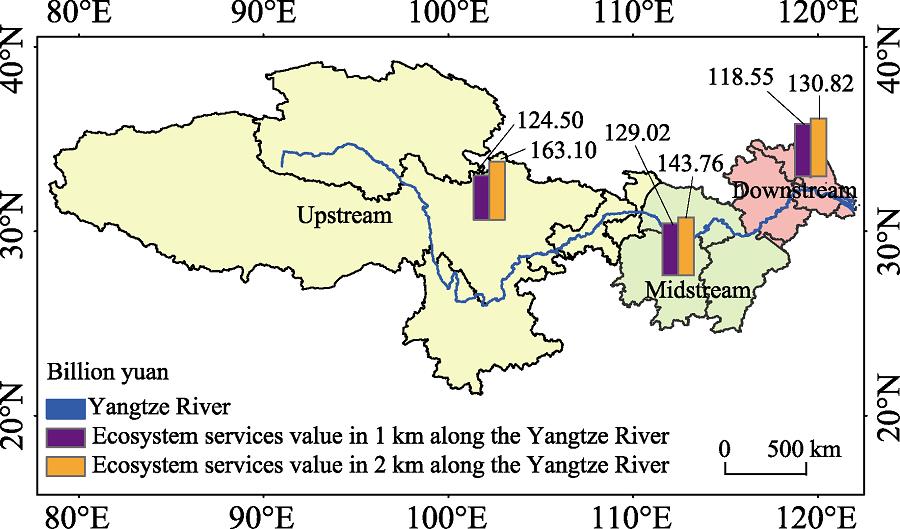
Fig. 2. Ecosystem services value along the upper, middle and lower reaches of the Yangtze River in 2017
Fig. 3. Ecosystem services values in the provincial-level regions along the Yangtze River in 2017
Fig. 4. Unit area ecosystem services value along the Yangtze River in 2017
Fig. 5. Increment of ecosystem services value along the Yangtze River in 2017
Provisioning services | Regulating services | Supporting services | Cultural services |
---|
Food production (FP)Raw material production (RP)Water supply (WS) | Gas regulation (GR)Climate regulation (CR)Environmental purification (EP)Hydrological regulation (HR) | Soil retention (SR)Species diversity (SD) | Aesthetic landscapes (AL) |
|
Table 1. Classification of ecosystem services
Ecosystem service equivalent value per unit area |
---|
Ecosystem classification | Provisioning services | Regulating services | Supporting services | Cultural services | Primary classification | Secondary classification | FP | RP | WS | GR | CR | EP | HR | SR | SD | AL | Farmland | Dry land | 0.85 | 0.4 | 0.02 | 0.67 | 0.36 | 0.1 | 0.27 | 1.03 | 0.13 | 0.06 | Paddy field | 1.36 | 0.09 | -2.63 | 1.11 | 0.57 | 0.17 | 2.72 | 0.01 | 0.21 | 0.09 | Forest | Coniferous and broad-leaved mixed forest | 0.31 | 0.71 | 0.37 | 2.35 | 7.03 | 1.99 | 3.51 | 2.86 | 2.6 | 1.14 | Grassland | Shrub | 0.19 | 0.43 | 0.22 | 1.41 | 4.23 | 1.28 | 3.35 | 1.72 | 1.57 | 0.69 | Shrubs | 0.38 | 0.56 | 0.31 | 1.97 | 5.21 | 1.72 | 3.82 | 2.4 | 2.18 | 0.96 | Wetlands | Wetlands | 0.51 | 0.5 | 2.59 | 1.9 | 3.6 | 3.6 | 24.23 | 2.31 | 7.87 | 4.73 | Desert | Desert | 0.01 | 0.03 | 0.02 | 0.11 | 0.1 | 0.31 | 0.21 | 0.13 | 0.12 | 0.05 | Bare land | 0 | 0 | 0 | 0.02 | 0 | 0.1 | 0.03 | 0.02 | 0.02 | 0.01 | Waters | River system | 0.8 | 0.23 | 8.29 | 0.77 | 2.29 | 5.55 | 102.24 | 0.93 | 2.55 | 1.89 |
|
Table 2. Ecosystem service equivalent value per unit area (yuan/ha)
Equivalent factor | China | Qinghai | Tibet | Sichuan | Yunnan | Chong-qing | Hubei | Hunan | Jiangxi | Anhui | Jiangsu |
---|
2010 | 481.19 | 359.49 | 518.53 | 487 | 346.53 | 498.41 | 550.65 | 572.8 | 519.6 | 450.43 | 592.64 | 2017 | 532.66 | 349.69 | 540.32 | 525.41 | 419.84 | 504.3 | 562.41 | 593.69 | 561.09 | 506.25 | 633.41 |
|
Table 3. Correction of the ecosystem services value per unit area (yuan/ha) of the Yangtze River Basin
| Region | Upper reaches | Middle reaches | Lower reaches |
---|
1 km | 2 km | 1 km | 2 km | 1 km | 2 km |
---|
Provisioning services | FP | 1.83 | 3.05 | 1.76 | 2.69 | 1.35 | 2.00 | RP | 1.35 | 2.41 | 0.53 | 0.76 | 0.38 | 0.51 | WS | 4.92 | 4.42 | 6.25 | 5.26 | 6.43 | 5.97 | Regulating services | GR | 4.94 | 8.87 | 2.29 | 3.53 | 1.62 | 2.35 | CR | 12.84 | 22.85 | 4.90 | 6.93 | 3.49 | 4.46 | EP | 7.17 | 10.29 | 6.12 | 7.03 | 5.52 | 6.19 | HR | 76.70 | 86.75 | 99.26 | 107.53 | 92.84 | 101.17 | Supporting services | SR | 5.36 | 9.49 | 1.92 | 2.65 | 1.43 | 1.78 | SD | 6.15 | 10.02 | 3.65 | 4.57 | 3.29 | 3.87 | Cultural services | AL | 3.23 | 4.96 | 2.36 | 2.82 | 2.21 | 2.54 |
|
Table 4. Value of different ecosystem services in the Yangtze River Basin in 2017 (billion yuan)
Province | Provisioning services | Regulating services | Supporting services | Cultural services |
---|
FP | RP | WS | GR | CR | EP | HR | SR | SD | AL |
---|
Qinghai | 0.0888 | 0.0865 | 0.5345 | 0.2902 | 0.8274 | 0.5401 | 6.5251 | 0.3537 | 0.4219 | 0.2317 | Tibet | 0.0497 | 0.0696 | 0.0951 | 0.2322 | 0.6378 | 0.2315 | 1.1288 | 0.2845 | 0.2641 | 0.1217 | Sichuan | 0.5278 | 0.4126 | 1.2240 | 1.4929 | 3.8585 | 1.9934 | 19.4919 | 1.6417 | 1.8025 | 0.9243 | Yunnan | 0.4623 | 0.4130 | 0.7399 | 1.4977 | 3.9535 | 1.7036 | 13.3708 | 1.6477 | 1.7023 | 0.8297 | Chongqing | 0.7058 | 0.3711 | 2.3247 | 1.4290 | 3.5615 | 2.6985 | 36.1861 | 1.4362 | 1.9590 | 1.1249 | Hubei | 1.2793 | 0.4184 | 5.0206 | 1.7553 | 3.9179 | 4.7731 | 76.7507 | 1.5561 | 2.8869 | 1.8580 | Hunan | 0.1489 | 0.0312 | 0.3402 | 0.1603 | 0.2808 | 0.3909 | 6.5989 | 0.1029 | 0.2228 | 0.1475 | Jiangxi | 0.3294 | 0.0763 | 0.8858 | 0.3731 | 0.6996 | 0.9517 | 15.9076 | 0.2617 | 0.5429 | 0.3579 | Anhui | 0.6930 | 0.1949 | 2.6488 | 0.8452 | 1.7636 | 2.4713 | 41.0256 | 0.7056 | 1.4649 | 0.9679 | Jiangsu | 0.5792 | 0.1668 | 3.6851 | 0.6678 | 1.5509 | 2.8647 | 49.5145 | 0.6443 | 1.6248 | 1.1231 | Shanghai | 0.0743 | 0.0214 | 0.0947 | 0.1034 | 0.1728 | 0.1803 | 2.3006 | 0.0784 | 0.1977 | 0.1202 | Total | 4.9383 | 2.2616 | 17.5933 | 8.8472 | 21.2243 | 18.7990 | 268.8007 | 8.7127 | 13.0897 | 7.8070 |
|
Table 5. Ecosystem services value of provinces in 1 km along the Yangtze River in 2017 (billion yuan)
Province | Provisioning services | Regulating services | Supporting services | Cultural services |
---|
FP | RP | WS | GR | CR | EP | HR | SR | SD | AL |
---|
Qinghai | 0.1360 | 0.1658 | 0.6309 | 0.5587 | 1.5916 | 0.8025 | 7.6446 | 0.6807 | 0.7299 | 0.3721 | Tibet | 0.0921 | 0.1356 | 0.1295 | 0.4485 | 1.2359 | 0.4127 | 1.4988 | 0.5502 | 0.4970 | 0.2242 | Sichuan | 0.9252 | 0.7399 | 1.0231 | 2.7135 | 6.9125 | 2.9420 | 22.3420 | 2.9174 | 2.9888 | 1.4504 | Yunnan | 0.7629 | 0.7825 | 0.7285 | 2.8046 | 7.5283 | 2.7674 | 15.9221 | 3.1201 | 3.0620 | 1.4293 | Chongqing | 1.1381 | 0.5844 | 1.9039 | 2.3408 | 5.5787 | 3.3670 | 39.3446 | 2.2183 | 2.7440 | 1.4803 | Hubei | 2.0489 | 0.6096 | 4.1675 | 2.7886 | 5.5997 | 5.5100 | 83.2283 | 2.1601 | 3.6448 | 2.2321 | Hunan | 0.2524 | 0.0452 | 0.2274 | 0.2627 | 0.3933 | 0.4650 | 7.6276 | 0.1352 | 0.2814 | 0.1797 | Jiangxi | 0.3853 | 0.1015 | 0.8639 | 0.4829 | 0.9351 | 1.0541 | 16.6703 | 0.3547 | 0.6477 | 0.4092 | Anhui | 1.0070 | 0.2531 | 2.3904 | 1.1915 | 2.2195 | 2.7624 | 44.6651 | 0.8684 | 1.7111 | 1.1021 | Jiangsu | 0.8026 | 0.2086 | 3.5493 | 0.9202 | 1.8903 | 3.1166 | 52.6429 | 0.7676 | 1.8346 | 1.2410 | Shanghai | 0.1869 | 0.0442 | 0.0316 | 0.2337 | 0.3500 | 0.3094 | 3.8588 | 0.1471 | 0.3275 | 0.1942 | Total | 7.7373 | 3.6705 | 15.6460 | 14.746 | 34.2348 | 23.5090 | 295.4449 | 13.9198 | 18.4686 | 10.3145 |
|
Table 6. Ecosystem services value of provinces in the 2 km along the Yangtze River in 2017 (billion yuan)