
Liang ZHENG, Hai LIU, Yuefei HUANG, Shoujing YIN, Gui JIN. Assessment and analysis of ecosystem services value along the Yangtze River under the background of the Yangtze River protection strategy[J]. Journal of Geographical Sciences, 2020, 30(4): 553
- Journal of Geographical Sciences
- Vol. 30, Issue 4, 553 (2020)
Abstract
Keywords
1 Introduction
Ecosystem services are benefits that are directly or indirectly derived through the structure, processes, and functions of ecosystems. The concept was first proposed by
In recent years, many studies have been conducted on the evaluation of ecosystem services worldwide. With the introduction of remote sensing and other spatial information data, the field of ecosystem services assessment expanded, and ecosystem services value assessments were developed. Currently, the main evaluation methods include the material quality evaluation (
Land use patterns directly affect the types of services and supplies provided by ecosystems, with changes in land cover driving changes in ecosystem services (
China’s Yangtze River Basin has always occupied an extremely important position in China’s social and economic development, with vast natural resources, a diverse economic culture, and important geographical advantages. There have been great achievements in the governance and development of the Yangtze River region in recent decades, but at the same time the ecological environment of the river basin has undergone adverse changes that cannot be ignored. In 2018, the pollution of main tributaries in the Yangtze River Basin was relatively serious, with 14.2% of the tributaries exceeding class III, and 2% of the tributaries were inferior to class V (
Existing studies of ecosystem services in the Yangtze River Basin include
This study focused on the Yangtze River Basin and used regional land use data as the main data source. These data were combined with other data to estimate the values of 10 ecosystem services within 1 km and 2 km from the Yangtze River and each of the upper, middle, and lower reaches of the river were analyzed. The ecosystem services value in 11 provincial-level regions and an in-depth analysis of the current ecological environment in the Yangtze River Basin are of great significance for guiding the ecological construction of the basin and achieving a ‘win-win’ for regional development and ecological protection. It was estimated that the ecological protection work in the Yangtze River Basin has impacted on the ecosystem services value of the basin ecosystem, providing a reference for the further protection of the Yangtze River and the healthy and efficient development of the Yangtze River Economic Belt.
2 Materials and data
2.1 Research area
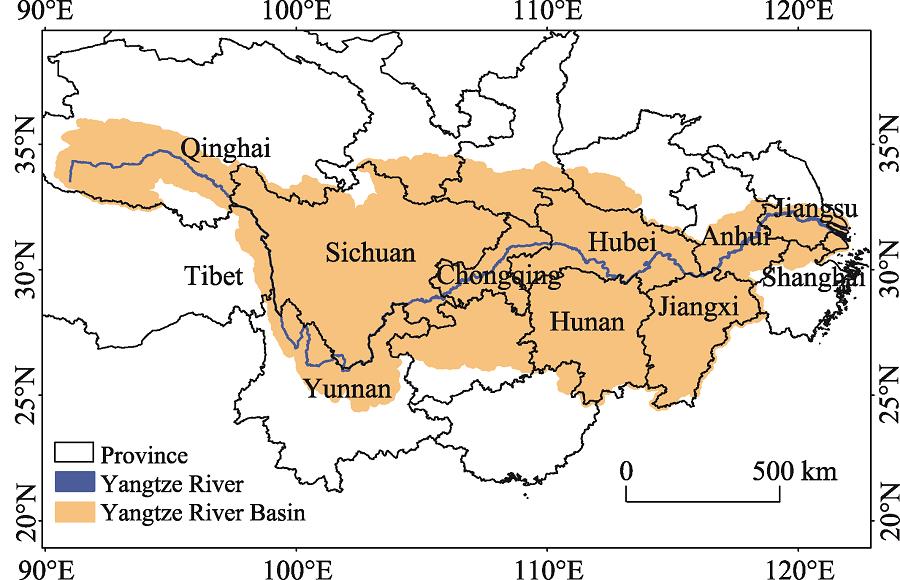
The Yangtze River is the largest river in Asia. It is the third largest river in the world, and it is the longest river in China (
![]()
Figure 1.
Because of its rich resources and numerous tributaries and lakes, as the Yangtze River traverses the southern area of China it provides important economic linkages for China’s eastern and western regions. The Yangtze River Economic Belt covers 11 provinces and cities, including Shanghai, Jiangsu, Zhejiang, Anhui, Jiangxi, Hubei, Hunan, Chongqing, Sichuan, Yunnan, and Guizhou, with an area of approximately 2.05 million km2. The population and GDP account for more than 40% of the national total in China. The Yangtze River Economic Belt Strategy is a new round of reform and opening up and is important to the implementation of China’s new regional open development strategy. It is a globally influential inland economic belt, a coordinated development zone for east-west interaction and cooperation, and an example of China opening to the outside world along the coast. It is also the first demonstration zone for the construction of an ecological civilization in China.
2.2 Definition of research scope
To promote the protection of the ecological environment of the Yangtze River Economic Belt, the Ministry of Environmental Protection, the Development and Reform Commission, and the Ministry of Water Resources jointly issued the Plan for the Protection of the Ecological Environment of the Yangtze River Economic Belt in July 2017. In the plan, it is clearly stated that new chemical industry facilities should be strictly prohibited within 1 km of the mainstream and its main tributaries, and that new petrochemical and coal chemical projects should be strictly controlled along the middle and upper reaches of the Yangtze River. To transfer highly polluting and high-emission enterprises from the downstream to upstream areas, industries that do not meet the requirements for shoreline locations, specific river and land sections, and an appropriate layout must withdraw unconditionally. Therefore, the study selected a l-km region from the river as the core research area. The ‘Conservation of the Yangtze River’ strategy aims to shut down chemical companies within 15 km of the coast by 2025. The satellite remote sensing center of the Ministry of Environmental Protection of China interprets land use data within 2 km of the Yangtze River. Based on this background, after exploring the ecosystem services value in 1 km along the Yangtze River, the scope was expanded to 2 km from the river, to further explore the impact of the Yangtze River Conservation Project on the ecosystem services value, and provide a reference for future work.
2.3 Data
The number of land uses was determined from the 2017 high score of the Gaofen satellite 1 (GF-1) and the resources satellite three (ZY-3) and was determined from cloudless or less cloudy (cloud coverage ratio <1%) remote sensing images. The spatial resolution of the remote sensing images was 8 m2/m and 6 m2/m for multispectral and full color images, respectively. This enabled the interpretation of land use types within 2 km of the Yangtze River. The net primary productivity (NPP) simulation data for the Yangtze River Basin in 2017 was obtained from the China National Earth System Science Data Sharing Platform (www. geodata.cn). The areas planted with rice, wheat, and corn, and the grain yield and unit area income and expenditure values were from 2017. The data were obtained from the China Statistical Yearbook and Compilation of Cost-Benefit Data of National Agricultural Products.
3 Methods
3.1 Classification of ecosystem services
In this study, ecosystem services were classified based on the methods of the Millennium Ecosystem Assessment (MA) (
| Provisioning services | Regulating services | Supporting services | Cultural services |
|---|---|---|---|
| Food production (FP) | Gas regulation (GR) | Soil retention (SR) | Aesthetic landscapes (AL) |
Table 1.
Classification of ecosystem services
3.2 Correction of the ecosystem services value per unit area
The basic equivalent of the ecosystem services value per unit area enables an assessment of the ecosystem services value in regional ecosystems. This value refers to the annual average value equivalent of various service functions per unit area for different types of ecosystems. Referring to the ecosystem services value calculated by Xie Gaodi (2010) (
| Ecosystem service equivalent value per unit area | |||||||||||
|---|---|---|---|---|---|---|---|---|---|---|---|
| Ecosystem classification | Provisioning | Regulating services | Supporting | Cultural | |||||||
| Primary classification | Secondary | FP | RP | WS | GR | CR | EP | HR | SR | SD | AL |
| Farmland | Dry land | 0.85 | 0.4 | 0.02 | 0.67 | 0.36 | 0.1 | 0.27 | 1.03 | 0.13 | 0.06 |
| Paddy field | 1.36 | 0.09 | -2.63 | 1.11 | 0.57 | 0.17 | 2.72 | 0.01 | 0.21 | 0.09 | |
| Forest | Coniferous and broad-leaved mixed forest | 0.31 | 0.71 | 0.37 | 2.35 | 7.03 | 1.99 | 3.51 | 2.86 | 2.6 | 1.14 |
| Grassland | Shrub | 0.19 | 0.43 | 0.22 | 1.41 | 4.23 | 1.28 | 3.35 | 1.72 | 1.57 | 0.69 |
| Shrubs | 0.38 | 0.56 | 0.31 | 1.97 | 5.21 | 1.72 | 3.82 | 2.4 | 2.18 | 0.96 | |
| Wetlands | Wetlands | 0.51 | 0.5 | 2.59 | 1.9 | 3.6 | 3.6 | 24.23 | 2.31 | 7.87 | 4.73 |
| Desert | Desert | 0.01 | 0.03 | 0.02 | 0.11 | 0.1 | 0.31 | 0.21 | 0.13 | 0.12 | 0.05 |
| Bare land | 0 | 0 | 0 | 0.02 | 0 | 0.1 | 0.03 | 0.02 | 0.02 | 0.01 | |
| Waters | River system | 0.8 | 0.23 | 8.29 | 0.77 | 2.29 | 5.55 | 102.24 | 0.93 | 2.55 | 1.89 |
Table 2.
Ecosystem service equivalent value per unit area (yuan/ha)
In terms of space, this study used the ratio of the unit area grain yield of different provinces in the study area to the output of farmland grain area per unit area as the revised coefficient and revised the ecosystem services value per unit area to the ecosystem services value per unit area of the Yangtze River Basin. In terms of time, the service value per unit area of the Yangtze River Basin ecosystem was revised using the food production data per unit area in 2017. The corrected results are shown in
| Equivalent factor | China | Qinghai | Tibet | Sichuan | Yunnan | Chong-qing | Hubei | Hunan | Jiangxi | Anhui | Jiangsu |
|---|---|---|---|---|---|---|---|---|---|---|---|
| 2010 | 481.19 | 359.49 | 518.53 | 487 | 346.53 | 498.41 | 550.65 | 572.8 | 519.6 | 450.43 | 592.64 |
| 2017 | 532.66 | 349.69 | 540.32 | 525.41 | 419.84 | 504.3 | 562.41 | 593.69 | 561.09 | 506.25 | 633.41 |
Table 3.
Correction of the ecosystem services value per unit area (yuan/ha) of the Yangtze River Basin
Considering the close relationship between biomass and ecosystem services (
3.3 Calculation of ecosystem service value
After correcting the ecosystem services value per unit area, the value of the ecosystem service per unit area was obtained for different land use types by combining the basic equivalent factor tables of different types of ecosystems and the values of different types of ecosystem services. Then, based on the land use data of the study area, the total ecosystem services value of the study area was obtained. The calculation was as follows:
where ESV is the total ecosystem services value, Si is the area of the i-type of land use in the study area, VCi is the ecosystem services value per unit area of the i-type of land use, and i is the land use type.
4 Results and analysis
4.1 The ecosystem services value
The ecosystem services value within 1 km and 2 km from the Yangtze River in 2017 was estimated using the revised ecosystem services value equivalent factors and the area of different land use types in the Yangtze River Basin. The study was conducted based on the upper, middle, and lower reaches of the river (
![]()
Figure 2.
To understand the ecological environment of the Yangtze River Basin, the value of 10 different ecosystem services in the Yangtze River Basin in 2017 was estimated (
| Region | Upper reaches | Middle reaches | Lower reaches | ||||
|---|---|---|---|---|---|---|---|
| 1 km | 2 km | 1 km | 2 km | 1 km | 2 km | ||
| Provisioning services | FP | 1.83 | 3.05 | 1.76 | 2.69 | 1.35 | 2.00 |
| RP | 1.35 | 2.41 | 0.53 | 0.76 | 0.38 | 0.51 | |
| WS | 4.92 | 4.42 | 6.25 | 5.26 | 6.43 | 5.97 | |
| Regulating services | GR | 4.94 | 8.87 | 2.29 | 3.53 | 1.62 | 2.35 |
| CR | 12.84 | 22.85 | 4.90 | 6.93 | 3.49 | 4.46 | |
| EP | 7.17 | 10.29 | 6.12 | 7.03 | 5.52 | 6.19 | |
| HR | 76.70 | 86.75 | 99.26 | 107.53 | 92.84 | 101.17 | |
| Supporting services | SR | 5.36 | 9.49 | 1.92 | 2.65 | 1.43 | 1.78 |
| SD | 6.15 | 10.02 | 3.65 | 4.57 | 3.29 | 3.87 | |
| Cultural services | AL | 3.23 | 4.96 | 2.36 | 2.82 | 2.21 | 2.54 |
Table 4.
Value of different ecosystem services in the Yangtze River Basin in 2017 (billion yuan)
Among the 10 ecosystem services, hydrological regulation contributed the most to the ecosystem services value, and raw material production contributed the least. Hydrological regulation accounted for 75.5% (67.4%), 88.2% (86.0%), and 89.7% (88.6%) in the upper, middle, and lower reaches of the Yangtze River in 1 km (2 km), respectively, while gas regulation accounted for 4.9% (6.9%), 2.8% (2.6%), and 1.6% (2.1%) in the upper, middle, and lower reaches, respectively. Among the provisioning services, water resources accounted for the largest proportion, accounting for 60.7% (44.7%), 73.2% (60.4%), and 78.8% (70.5%) in the upper, middle, and lower reaches of the Yangtze River in 1 km (2 km), respectively, while raw material production accounted for the smallest proportion, accounting for 16.7% (24.4%), 6.2% (8.7%), and 4.7% (6.0%) in the upper, middle, and lower reaches, respectively. Among the supporting services, species diversity accounted for 46.6% (48.6%), 34.5% (36.7%), and 30.3% (31.5%) in the upper, middle, and lower reaches of the Yangtze River in 1 km (2 km), respectively, while soil retention in the upper, middle, and lower reaches accounted for 53.4% (51.4%), 65.5% (63.3%), and 69.7% (68.5%), respectively.
4.2 Ecosystem services values in each province
The ecological service values in the provinces along the Yangtze River in 2017 were estimated (Tables 5 and 6). In 1 km (2 km) along the Yangtze River, the highest ecosystem services value was in Hubei Province, accounting for approximately 100.22 (111.99) billion yuan, which was 26.9% (25.6%) of the ecosystem services value of the whole Yangtze River Basin. Jiangsu, Chongqing, and Anhui provinces also had high values of 62.42 (66.97), 51.80 (60.70), and 52.78 (58.17) billion yuan, respectively, accounting for 16.8% (15.3%), 13.9% (13.9%), and 14.2% (13.3%) of the total ecosystem services value of the basin. In 1 km (2 km) along the Yangtze River, the lowest ecosystem services values were in Tibet Autonomous Region and Shanghai Municipality, at 311 (522) and 334 (568) million yuan, respectively, accounting for 0.83% (1.19%) and 0.90% (1.30%) of the total ecosystem services value of the basin (
| Province | Provisioning services | Regulating services | Supporting services | Cultural services | ||||||
|---|---|---|---|---|---|---|---|---|---|---|
| FP | RP | WS | GR | CR | EP | HR | SR | SD | AL | |
| Qinghai | 0.0888 | 0.0865 | 0.5345 | 0.2902 | 0.8274 | 0.5401 | 6.5251 | 0.3537 | 0.4219 | 0.2317 |
| Tibet | 0.0497 | 0.0696 | 0.0951 | 0.2322 | 0.6378 | 0.2315 | 1.1288 | 0.2845 | 0.2641 | 0.1217 |
| Sichuan | 0.5278 | 0.4126 | 1.2240 | 1.4929 | 3.8585 | 1.9934 | 19.4919 | 1.6417 | 1.8025 | 0.9243 |
| Yunnan | 0.4623 | 0.4130 | 0.7399 | 1.4977 | 3.9535 | 1.7036 | 13.3708 | 1.6477 | 1.7023 | 0.8297 |
| Chongqing | 0.7058 | 0.3711 | 2.3247 | 1.4290 | 3.5615 | 2.6985 | 36.1861 | 1.4362 | 1.9590 | 1.1249 |
| Hubei | 1.2793 | 0.4184 | 5.0206 | 1.7553 | 3.9179 | 4.7731 | 76.7507 | 1.5561 | 2.8869 | 1.8580 |
| Hunan | 0.1489 | 0.0312 | 0.3402 | 0.1603 | 0.2808 | 0.3909 | 6.5989 | 0.1029 | 0.2228 | 0.1475 |
| Jiangxi | 0.3294 | 0.0763 | 0.8858 | 0.3731 | 0.6996 | 0.9517 | 15.9076 | 0.2617 | 0.5429 | 0.3579 |
| Anhui | 0.6930 | 0.1949 | 2.6488 | 0.8452 | 1.7636 | 2.4713 | 41.0256 | 0.7056 | 1.4649 | 0.9679 |
| Jiangsu | 0.5792 | 0.1668 | 3.6851 | 0.6678 | 1.5509 | 2.8647 | 49.5145 | 0.6443 | 1.6248 | 1.1231 |
| Shanghai | 0.0743 | 0.0214 | 0.0947 | 0.1034 | 0.1728 | 0.1803 | 2.3006 | 0.0784 | 0.1977 | 0.1202 |
| Total | 4.9383 | 2.2616 | 17.5933 | 8.8472 | 21.2243 | 18.7990 | 268.8007 | 8.7127 | 13.0897 | 7.8070 |
Table 5.
Ecosystem services value of provinces in 1 km along the Yangtze River in 2017 (billion yuan)
| Province | Provisioning services | Regulating services | Supporting services | Cultural | ||||||
|---|---|---|---|---|---|---|---|---|---|---|
| FP | RP | WS | GR | CR | EP | HR | SR | SD | AL | |
| Qinghai | 0.1360 | 0.1658 | 0.6309 | 0.5587 | 1.5916 | 0.8025 | 7.6446 | 0.6807 | 0.7299 | 0.3721 |
| Tibet | 0.0921 | 0.1356 | 0.1295 | 0.4485 | 1.2359 | 0.4127 | 1.4988 | 0.5502 | 0.4970 | 0.2242 |
| Sichuan | 0.9252 | 0.7399 | 1.0231 | 2.7135 | 6.9125 | 2.9420 | 22.3420 | 2.9174 | 2.9888 | 1.4504 |
| Yunnan | 0.7629 | 0.7825 | 0.7285 | 2.8046 | 7.5283 | 2.7674 | 15.9221 | 3.1201 | 3.0620 | 1.4293 |
| Chongqing | 1.1381 | 0.5844 | 1.9039 | 2.3408 | 5.5787 | 3.3670 | 39.3446 | 2.2183 | 2.7440 | 1.4803 |
| Hubei | 2.0489 | 0.6096 | 4.1675 | 2.7886 | 5.5997 | 5.5100 | 83.2283 | 2.1601 | 3.6448 | 2.2321 |
| Hunan | 0.2524 | 0.0452 | 0.2274 | 0.2627 | 0.3933 | 0.4650 | 7.6276 | 0.1352 | 0.2814 | 0.1797 |
| Jiangxi | 0.3853 | 0.1015 | 0.8639 | 0.4829 | 0.9351 | 1.0541 | 16.6703 | 0.3547 | 0.6477 | 0.4092 |
| Anhui | 1.0070 | 0.2531 | 2.3904 | 1.1915 | 2.2195 | 2.7624 | 44.6651 | 0.8684 | 1.7111 | 1.1021 |
| Jiangsu | 0.8026 | 0.2086 | 3.5493 | 0.9202 | 1.8903 | 3.1166 | 52.6429 | 0.7676 | 1.8346 | 1.2410 |
| Shanghai | 0.1869 | 0.0442 | 0.0316 | 0.2337 | 0.3500 | 0.3094 | 3.8588 | 0.1471 | 0.3275 | 0.1942 |
| Total | 7.7373 | 3.6705 | 15.6460 | 14.746 | 34.2348 | 23.5090 | 295.4449 | 13.9198 | 18.4686 | 10.3145 |
Table 6.
Ecosystem services value of provinces in the 2 km along the Yangtze River in 2017 (billion yuan)
![]()
Figure 3.
In the provinces with a high total ecosystem services value, there were differences in the contributions of ecosystem services in 1 km and 2 km along the Yangtze River. In 1 km in Hubei Province, hydrological regulation and water supply were the most important ecosystem services, while hydrological regulation and climate regulation were more important in 2 km. Hydrological regulation and water supply were the most important ecosystem services in 1 km along the Yangtze River in Anhui Province, while in 2 km, hydrological regulation and environmental purification were more important. The types of ecosystem services that contributed most to the overall value in 1 km and 2 km along the Yangtze River in Chongqing and Jiangsu were the same.
The total ecosystem services value in each province and city was used to evaluate the regional ecosystem services value, and the ecosystem services value per unit area was used to compare the values of the regional ecological environments. By calculating the ecosystem services per unit area of the Yangtze River Basin in 2017, it was found that the ecosystem services value of 1 km (2 km) along the Yangtze River was the highest in Hubei Province at 1707.12 (16.6641) million yuan/ha, while the second highest was Jiangsu Province at 123.108 (11.5558) million yuan/ha. The ecosystem services value of 1 km in Chongqing was lower than that in Anhui Province, but the values in the 2 km displayed a different pattern, with the ecosystem services value being lower in the province. The ecosystem services value per unit area in 1 km (2 km) along the Yangtze River in Tibet and Shanghai was low, with Tibet accounting for 8239 (11680) million yuan/ha, followed by Shanghai at 8818 (1264) million yuan/ha. The ecosystem services value per unit area in Hubei Province was approximately 20.72 (14.27) times that of Tibet (
![]()
Figure 4.
5 Discussion
5.1 Ecosystem services value in the Yangtze River Basin
Within 1 km and 2 km along the Yangtze River, the ecosystem services value of the lower reaches was lower than that of the middle and upper reaches, mainly because the vegetation coverage of the upper and middle reaches was better than that of the lower reaches, and the average NPP in the upper and middle reaches was larger than in the lower reaches. In 1 km, the forest cover in the upper reaches was higher than in the middle reaches, and the cultivated land area in the middle reaches was equal to that in the middle reaches. However, the equivalent factor in the middle reaches was 1.22 times that in the lower reaches, and the NPP of vegetation in the middle reaches was higher than in the upper reaches, causing the ecosystem services value in the middle reaches to be higher than in the upper reaches. In the 2 km, the forestland area in the upper reaches accounted for 65% of the total area. Forestland was the main land use type, while forest cover in the middle reaches accounted for 19% of the total area. Cultivated land was the main land use type. Forest cover in the upper reaches was 9.85 times higher than in the middle reaches. The ecosystem services value in a unit area of forestland was higher than for other land uses, which increased the ecosystem services value in the upper reaches.
The differences in the ecosystem services value in the upper, middle, and lower reaches of the Yangtze River were mainly related to the land use pattern. Within 1 km, the proportion of forest and grassland in the upper and middle reaches of the Yangtze River was larger than that in the lower reaches of the Yangtze River. In the 2 km, the proportion of forest and grassland area in the upper reaches increased significantly, while the proportions of cultivated and bare land in the middle and lower reaches were larger. There were many areas of forest and grassland in the upper reaches of the river basin, and these ecosystems contained a large amount of biomass and had excellent ecological resources, resulting in a relatively high ecosystem services value in the region. The middle and lower reaches of the river basin were dominated by cultivated and bare land. The human activity in bare land areas interfered with the functioning of the ecosystems; thus, the ecosystem services value was lower than in the upper reaches.
Hydrological regulation (a regulating service) was the dominant service in the upper, middle, and lower reaches of the Yangtze River because the Yangtze River and its tributaries had enormous water resources and there were a large number of important wetlands along the river, which play an important role in regulating the hydrological functioning of the whole region. In addition to regulating services, the upstream area provided more supporting services than provisioning services, while the downstream and middle reaches provided more provisioning services than supporting services. In the upstream area forest cover was higher, human activities had less impact on the regional ecological environment, and the regional function of species protection in the aquatic germplasm resources reserve was stronger. Farmland and bare land accounted for a large proportion of the land area in the middle and lower reaches, and there was a relatively high level of human activity. Provisioning services provide the material basis of production and life for local residents. The food and raw material supplies are crucial for the livelihoods of local residents and have direct economic benefits for the region.
5.2 Ecosystem services value in the provinces
Among all land use types, the ecosystem services value of the river system was the highest, followed by that of wetland and coniferous-broad-leaved mixed forest. Among the provinces and cities within the Yangtze River Basin, Hubei Province had the largest water areas in 1 km and 2 km along the Yangtze River at 13.3498 and 14.1116 ha. The ecosystem services value of the river system was much higher than that of other land types, making the total ecosystem value of Hubei Province higher than that of other provinces and cities. Among the provinces and municipalities along the Yangtze River, Jiangsu Province had the largest area of wetland and the second largest area of water; thus, the total ecosystem services value was the highest in Jiangsu Province. The total ecosystem services value in Tibet and Shanghai was relatively low, mainly due to the low ecosystem services value of the main land use types in the region.
In the estimation of ecosystem services value per unit area, Hubei Province had the highest value in terms of its cities along the Yangtze River. There are abundant water resources in Hubei Province. The water supply and hydrological regulation of the water system have a high value in terms of the regional ecological environment. Wetlands play an important role in the protection of regional biodiversity, regulation of runoff and climate, and can also improve water quality. Wetlands will enhance water supply, provide hydrological regulation, and improve biodiversity. Jiangsu Province has a large water and wetland area; thus, the province had a better regional ecological environment than the other provinces that the Yangtze River flows through. In 1 km and 2 km along the Yangtze River in Tibet, there was little vegetation cover and relatively low biodiversity, which resulted in a low regional environmental carrying capacity and fragile ecological environment. The regional water resources are limited and hydrological regulation is poor. There are many different ecological and environmental problems in the region, such as grassland degradation, land desertification, and soil erosion. As a national mega city, Shanghai has experienced rapid economic development, with an increase in both the area of built-up land and population. Limitations in the ecological carrying capacity have become increasingly prominent in the region, which has resulted in the low ecosystem services value per unit area.
5.3 The impact of ecological protection measures on the environment
On January 5, 2016, President Xi highlighted the development of the Yangtze River Economic Belt in Chongqing. The promotion of the development of the Yangtze River Economic Belt must adhere to the strategic orientation of prioritizing the ecological environment and green development, and the current and future processes will be maintained over the long term. Restoring the Yangtze River ecological environment is an enormous task, with the area in need of a large amount of protection rather than development. Based on the current problems of increased ecosystem fragmentation, over-exploitation of natural shorelines, and extensive use of environmental resources in the Yangtze River Basin, the relevant departments of the state have formulated policies for improving the ecological environment, developing the economic transformation process, and reforming the economic system and its mechanisms. At the same time, the local governments of provinces and cities along the Yangtze River are encouraged to implement measures to protect the ecological environment in the region’s peripheral to the coastline, to create a red line for the protection of ecological areas and other environmentally sensitive areas. The discharge of domestic wastewater from villages along the Yangtze River is an important factor affecting the ecological environment of the Yangtze River. Through field investigations, it was found that in addition to the ‘reconstruction and transformation’ of chemical enterprises within 1 km along the Yangtze River, some provinces and cities have also increased their water protection measures. The demolition and relocation of villages within 1 km of the river and the comprehensive regreening of shorelines would enable a quantitative prediction of the improvement in ecosystem services value, with the demolition area reclaimed for planting shrubs. The results showed that the total ecosystem services value in the Yangtze River Basin was 37.207 billion yuan in 1 km along the Yangtze River in 2017. After the relocation of villages, the total ecosystem services value was estimated to be 37.734 billion yuan, i.e., the total value of regional ecosystem services would increase by 527 million yuan. In 2 km along the Yangtze River, the total ecosystem services value was 437 million yuan in 2017. After the relocation of villages, the total ecosystem services value was estimated to be 44.744 billion yuan, representing an increase of 975 million yuan in the total ecosystem services value (
![]()
Figure 5.
5.4 Proposal
To ensure the management of the ecological environment of the Yangtze River, it is necessary to clarify the problems involved in the overall protection of the basin, including the interconnections of water and ecological problems, the conflicts between development and protection in key areas, and the prioritization of the ecological and environmental functions of the Yangtze River Economic Belt. We need new methods of green development. In terms of governance, there is a need to co-ordinate the overall protection, system rehabilitation, and comprehensive management of the upper, middle, and lower reaches of the river. High-intensity hydropower development and resource development in the upper reaches of the basin have caused great ecological damage and have directly affected the ecological environment in the middle and lower reaches. Therefore, in upstream management, prevention and protection should be the main priorities, and hydropower development should be strictly controlled and restricted to downstream areas. The space for development should consider the protection and restoration of the environment, controlling the releases of water resources in the middle and upper reaches of the basin, and ensuring an adequate water flow for ecological purposes during the dry season. There is also a need to actively respond to the intrusion of salt-water from the sea, the shrinkage of the wetlands in the middle reaches, and the degradation of rivers and lakes. Other problems include the overloading of resources and the environment, and large amounts of discharged pollutants. Therefore, in downstream management, ecological recovery should be the main focus.
6 Conclusions
This study used Costanza’s method of estimating the ecosystem services value, and revised Xie Gaodi’s “Equivalent ecosystem services value per unit area of China’s ecosystem” using the value of farmland production services and NPP. Ten different ecosystem services were analyzed in 1 km and 2 km from the Yangtze River in 2017, and the ecosystem services value in the upper, middle, and lower reaches of the Yangtze River Basin was estimated. The ecosystem services value of 11 provinces and cities along the Yangtze River was determined and the analysis was repeated for areas in 1 km and 2 km under conditions where the existing villages were relocated. The results showed the following:
(1) The total ecosystem services value along the Yangtze River in 1 km was 37.208 billion yuan. The total ecosystem services value in the middle reaches > the total ecosystem services value in the upper reaches > the total ecosystem services value in the lower reaches. The total ecosystem services value in 2 km was 43.769 billion yuan, and the total ecosystem services value in the upper reaches > the total ecosystem services value in the middle reaches > the ecosystem services value in the lower reaches.
(2) Within the whole Yangtze River Basin, regulating services accounted for 81.6% (78.9%) of the ecosystem services value in 1 km (2 km) along the Yangtze River. The contributions of provisioning, supporting, and cultural services to the ecosystem services value in the upper, middle, and lower reaches of the Yangtze River were different. In addition to the regulating services, the order was as follows: supporting services > provisioning services > cultural services in the upper reaches of the Yangtze River. In the middle and lower reaches of the Yangtze River, in addition to the regulating services, the order was as follows: provisioning services > supporting services > cultural services. Among the 10 ecosystem services, hydrological regulation made the largest contribution to the ecosystem services value, while raw material production contributed the least.
(3) In 1 km (2 km) along the Yangtze River, the highest ecosystem services value was estimated in Hubei Province, which accounted for approximately 10.222 (111.99) billion yuan or 26.9% (25.6%) of the total ecosystem services value in the Yangtze River Basin. The lowest ecosystem services values were estimated in Tibet and Shanghai, with values of 311 (522) and 334 (568) million yuan, respectively. The differences in total ecosystem services value among provinces were related to land use types.
(4) In 1 km along the Yangtze River, the total ecological value of the region was estimated to increase by 527 million yuan after the relocation of villages. In 2 km along the Yangtze River, the total ecological value of the region was estimated to increase by 975 million yuan after the relocation of villages.
References
[1] L Anselin. Local indicators of spatial association: LISA. Geographical Analysis, 27, 93-115(1995).
[2] L Berta M, B Erik G, L Marina G et al. Trade-offs across value-domains in ecosystem services assessment. Ecological Indicators, 37, 220-228(2014).
[3] J Bolliger, M Bttig, J Gallati et al. Landscape multifunctionality: A powerful concept to identify effects of environmental change. Regional Environment Change, 11, 203-206(2011).
[4] W Chen, J Li, L Zhu. Spatial heterogeneity and sensitivity analysis of ecosystem services value in the Middle Yangtze River region. Journal of Natural Resources, 34, 325-337(2019).
[5] J Cheng, J Cheng, J Wu et al. Changes of land use and ecosystem service functions in Yangtze River Basin from 2000-2010. Resources and Environment in the Yangtze Basin, 26, 894-901(2017).
[6] R Costanza, d’Arge Ralph, G Rudolf et al. The value of the world’s ecosystem services and natural capital. World Environment, 387, 3-15(1997).
[7] C Daily G, S Polasky, J Goldstein et al. Ecosystem services in decision making: time to deliver. Frontiers in Ecology & the Environment, 7, 21-28(2009).
[8] B Fisher, K Turner R. Ecosystem services: Classification for valuation. Biological Conservation, 141, 1167-1169(2008).
[9] B Fu. Trends and priority areas in ecosystem research of China. Geographical Research, 29, 383-396(2010).
[10] B Fu, D Yu, N Lv. Indicator systems and methods for evaluating biodiversity and ecosystem services. Acta Ecologica Sinica, 37, 341-348(2017).
[11] C Huang, J Yang, W Zhang. Development of ecosystem services evaluation models: Research progress. Chinese Journal of Ecology, 32, 3360-3367(2013).
[12] H Xu, A Newton, E Wolanski et al. The fate of phosphorus in the Yangtze (Changjiang) Estuary, China, under multi-stressors: Hindsight and forecast. Estuarine, Coastal and Shelf Science, 20, 1-6(2015).
[13] G Jin, K Chen, P Wang et al. Trade-offs in land-use competition and sustainable land development in the North China Plain. Technological Forecasting and Social Change, 141, 36-46(2019).
[14] G Jin, Z Deng X, D Zhao X et al. Spatiotemporal patterns in urbanization efficiency within the Yangtze River Economic Belt between 2005 and 2014. Journal of Geographical Sciences, 28, 1113-1126(2018).
[15] G Jin, H Li Z, Z Deng X et al. An analysis of spatiotemporal patterns in Chinese agricultural productivity between 2004 and 2014. Ecological Indicators, 105, 591-600(2019).
[16] U Kreuter, H Hrris, M Malock et al. Change in ecosystem service values in the San Antonio area, Texas. Ecological Economics, 39, 333-346(2001).
[17] C Li S, L Bing Z, G Jin. Spatially explicit mapping of soil conservation service in monetary units due to land use/cover change for the Three Gorges Reservoir Area, China. Remote Sensing, 11, 468(2019).
[18] H Liu, J Wu, X Chen. Study on spatial-temporal change and trade-off/synergy relationships of ecosystem services in the Danjiangkou water area. Acta Ecologica Sinica, 38, 4609-4624(2018).
[19] Y Liu, H Long. Study on the spatiotemporal patterns of land use transition and its impact on ecological service function of the middle of Yangtze River Economic Belt. Economic Geography, 37, 161-170(2017).
[20] K Meijer. Ecosystems and human well-being: Our human planet: Summary for decision makers (Millennium Ecosystem Assessment Series). Journal of Chromatography A, 1180, 66-72(2008).
[21] Ecosystems and human well-being: Biodiversity synthesis. Washington DC: World Resources Institute.(2005).
[22] . Chinese Statistical Yearbook.(2010).
[23] . China Statistical Yearbook.(2017).
[24] M Nieto-Romero, E Oteros-Rozas, , A José et al. Exploring the knowledge landscape of ecosystem services assessments in Mediterranean agroecosystems: Insights for future research. Environmental Science & Policy, 37, 121-133(2014).
[25] Z Ouyang, X Wang, H Miao. A primary study on Chinese terrestrial ecosystem services and their ecological-economic values. Acta Ecologica Sinica, 19, 607-613(1999).
[26] J Priess, M Minler, A Klein. Linking deforestation scenarios to pollination services and economic return in coffee agroforestry systems. Ecological Applications, 17, 407-417(2007).
[27] C Raudsepp-Hearne, D Peterson G, A Mooney B H. Ecosystem service bundles for analyzing tradeoffs in diverse landscapes. Proceedings of the National Academy of Sciences of the United States of America, 107, 5242-5247(2010).
[28] . National Agricultural Products Cost Return Assembly.(2011).
[29] L Wang, Q He. A review of the ecosystem value based on emergy theory. Ecological Economy, 31, 133-136(2015).
[30] J Wiens. Landscape ecology as a foundation for sustainable conservation. Landscape Ecology, 24, 105-1065(2009).
[31] L Wilson C, H Matthews W. Mans impact on the global environment: Assessment and recommendations for action. Report of the Study of Critical Environment Problems (SCEP) 1970, 319(1970).
[32] G Xie, C Zhang, L Zhang et al. Improvement of the evaluation method for ecosystem service value based on per unit area. Journal of Natural Resources, 30, 1243-1254(2015).
[33] G Xie, L Zhen, C Lu et al. Expert knowledge based valuation method of ecosystem services in China. Journal of Natural Resources, 23, 911-919(2008).
[34] J Yang R, J Wang L, L Liu W et al. Design and progress of joint research on ecological environment protection and restoration of the Yangtze River. Environment and Sustainable Development, 44, 37-42(2019).
[35] S Yang, S Hu, S Qu. Spatial dynamics of ecosystem service value in middle Yangtze River Economic Region from 1990 to 2014. Research of Soil and Water Conservation, 25, 164-169(2018).


Set citation alerts for the article
Please enter your email address

© Copyright 2018-2021 | Chinese Laser Press. All Rights Reserved 沪ICP备15018463号-20