• Journal of Natural Resources
  • Vol. 35, Issue 4, 937 (2020)
Hai XUE* and Fan ZHANG
Author Affiliations
  • School of Water Conservancy, North China University of Water Resources and Electric Power, Zhengzhou 450046, China
  • show less
    DOI: 10.31497/zrzyxb.20200415 Cite this Article
    Hai XUE, Fan ZHANG. Study on the relationship between precipitation and urban atmospheric environment: Cases of 113 key environmental protection cities[J]. Journal of Natural Resources, 2020, 35(4): 937 Copy Citation Text show less
    Spatial distribution of key environmental protection cities
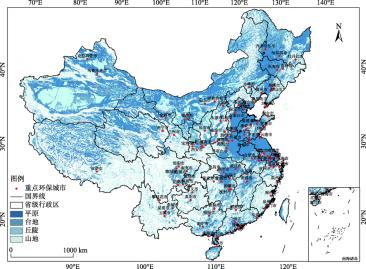
    Fig. 1. Spatial distribution of key environmental protection cities
    Pollutant concentration value
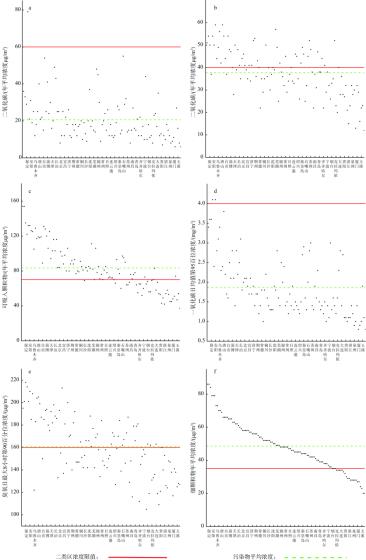
    Fig. 2. Pollutant concentration value
    Environmental protection key cities cluster spectrum map
    Fig. 3. Environmental protection key cities cluster spectrum map
    Dynamic variation diagram of six kinds of urban clustering distribution
    Fig. 4. Dynamic variation diagram of six kinds of urban clustering distribution
    Linear fitting equation of precipitation and atmospheric pollution eigenvalues
    Fig. 5. Linear fitting equation of precipitation and atmospheric pollution eigenvalues
    特征变量SO2
    /(μg/m3)
    NO2
    /(μg/m3)
    PM10
    /(μg/m3)
    CO
    /(mg/m3)
    O3
    /(μg/m3)
    PM2.5
    /(μg/m3)
    P
    /mm
    平均值20.1637.7383.481.86160.9448.58937.93
    中位数18.0038.0080.001.60160.0048.00813.50
    方差142.01109.4325.550.559714.15217.93236936.79
    最小值6.0012.0037.000.80105.0020.00108.90
    最大值79.0059.00154.004.10218.0086.002256.50
    Table 1. Statistical characteristic values of air pollutants and precipitation in 113 cities
    变量分类数
    SO218.41**15.40**31.92**27.21**24.62**21.75**
    NO242.34**36.35**30.17**26.99**23.62**23.28**
    PM1084.72**81.70**72.42*64.18**57.59**51.29**
    CO24.59**32.63**63.37**54.31**49.75**47.63**
    O355.63**46.15**39.18*33.27**29.02**25.99**
    PM2.570.36**69.51**61.91**54.95**48.95**43.11**
    P7.78**6.37**11.27**11.17**32.30*28.55**
    Table 2. Statistical test of six classifications
    SO2NO2PM10COO3PM2.5P
    个案数113113113113113113113
    最极端差值绝对0.150.040.110.140.070.060.12
    0.150.040.110.140.070.060.12
    -0.12-0.04-0.07-0.09-0.06-0.03-0.07
    检验统计0.150.040.110.140.070.060.12
    渐近显著性(双尾)00.20.00100.20.20.0001
    相关系数ρ-0.62**-0.32**-0.57**-0.70**-0.24*-0.33**1
    Table 3. Normality test and significance analysis
    SO2NO2PM10COO3PM2.5
    拟合系数T检验拟合系数T检验拟合系数T检验拟合系数T检验拟合系数T检验拟合系数T检验
    b32.8916.05**44.9521.66**2.7424.34**112.0819.11**59.5934.84**174.0820.13**
    a-0.02-6.68**-0.01-3.10**-0.01-6.07**-0.03-5.58**-0.01-3.38**-0.01-3.19**
    R20.280.130.330.370.150.06
    Table 4. Linear regression results and fitting tests
    Hai XUE, Fan ZHANG. Study on the relationship between precipitation and urban atmospheric environment: Cases of 113 key environmental protection cities[J]. Journal of Natural Resources, 2020, 35(4): 937
    Download Citation