• Acta Optica Sinica
  • Vol. 43, Issue 6, 0601008 (2023)
Pei Tang1、2, Shiyong Shao1、*, Qiang Liu1, Manman Xu1、2, Haixu Wang1, and Yong Han3
Author Affiliations
  • 1Key Laboratory of Atmospheric Optics, Anhui Institute of Optics and Fine Mechanic, Hefei Institutes of Physical Science, Chinese Academy of Sciences, Hefei 230031, Anhui, China
  • 2Science Island Branch of Graduate School, University of Science and Technology of China, Hefei 230026, Anhui, China
  • 3School of Atmospheric Sciences, Sun Yat-sen University, Zhuhai 519000, Guangdong, China
  • show less
    DOI: 10.3788/AOS221544 Cite this Article Set citation alerts
    Pei Tang, Shiyong Shao, Qiang Liu, Manman Xu, Haixu Wang, Yong Han. Particle Size Distribution Analysis of Submicron Marine Aerosol Based on Shipboard Measurement[J]. Acta Optica Sinica, 2023, 43(6): 0601008 Copy Citation Text show less
    Variation of aerosol number concentration and offshore distance. (a) 2019-06-08; (b) 2019-06-16
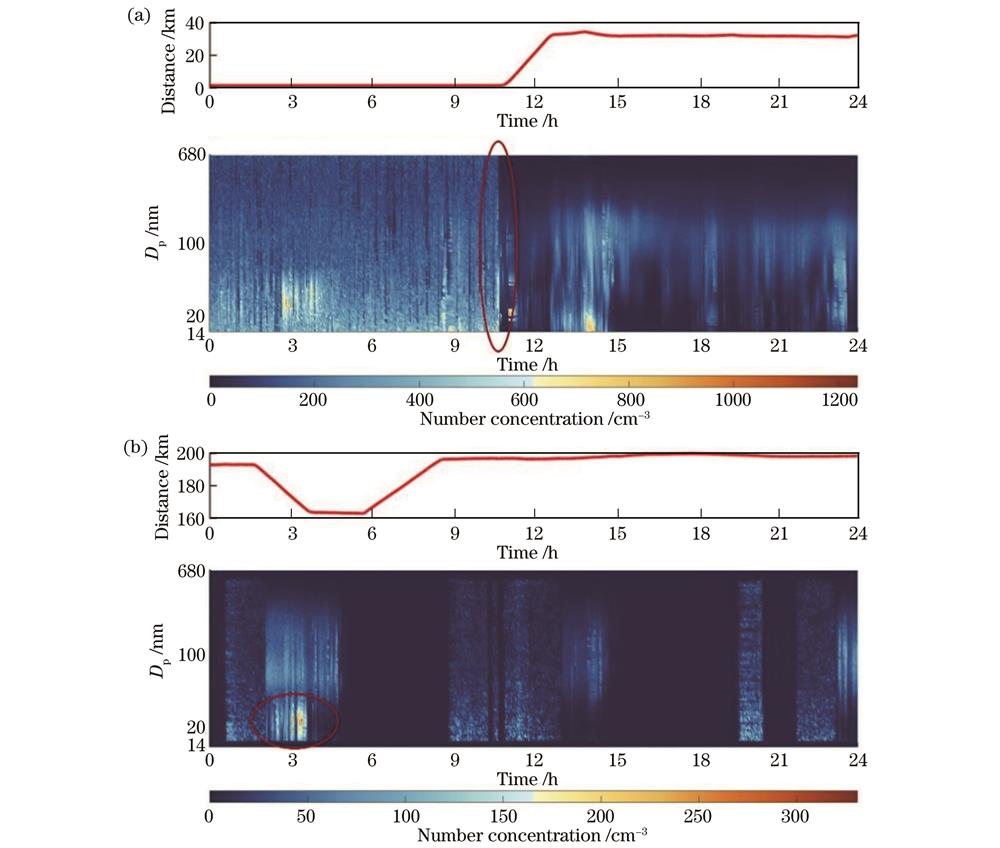
    Fig. 1. Variation of aerosol number concentration and offshore distance. (a) 2019-06-08; (b) 2019-06-16
    Diurnal variation of total aerosol number concentration and offshore distance
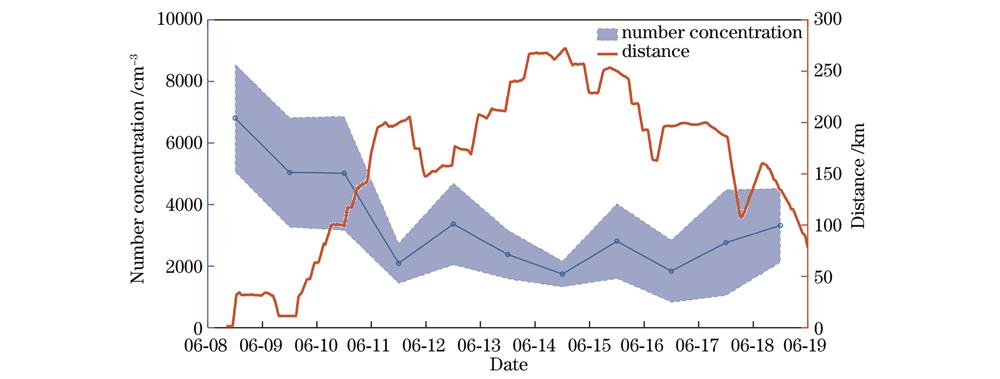
    Fig. 2. Diurnal variation of total aerosol number concentration and offshore distance
    Diurnal variation of proportions of aerosol number concentrations of three modes and offshore distance
    Fig. 3. Diurnal variation of proportions of aerosol number concentrations of three modes and offshore distance
    Median particle size spectra. (a) 2019-06-08; (b) 2019-06-10; (c) 2019-06-13; (d) comparison of above three days
    Fig. 4. Median particle size spectra. (a) 2019-06-08; (b) 2019-06-10; (c) 2019-06-13; (d) comparison of above three days
    Daily variations in meteorological elements from June 12 to June 17, 2019. (a) Temperature; (b) specific humidity; (c) wind speed; (d) wind direction
    Fig. 5. Daily variations in meteorological elements from June 12 to June 17, 2019. (a) Temperature; (b) specific humidity; (c) wind speed; (d) wind direction
    Back trajectories of air masses before and after cold front
    Fig. 6. Back trajectories of air masses before and after cold front
    Distribution variation of marine aerosol components before and after cold front. (a) 12:00 at 2019-06-13; (b) 12:00 at 2019-06-14; (c) 12:00 at 2019-06-15; (d) 12:00 at 2019-06-16
    Fig. 7. Distribution variation of marine aerosol components before and after cold front. (a) 12:00 at 2019-06-13; (b) 12:00 at 2019-06-14; (c) 12:00 at 2019-06-15; (d) 12:00 at 2019-06-16
    Particle size distribution variation of marine aerosol components before and after cold front
    Fig. 8. Particle size distribution variation of marine aerosol components before and after cold front
    AreaNucleation modeAitken modeAccumulation modeTotalRef.
    Northeastern South China Sea at 2019-06-08960348123716812±1759Proposed
    Northeastern South China Sea at 2019-06-09746298213175045±1785Proposed
    Northeastern South China Sea at 2019-06-10622294314505015±1856Proposed
    Northeastern South China Sea at 2019-06-1118010738392092±656Proposed
    Northeastern South China Sea at 2019-06-12289171913613369±1332Proposed
    Northeastern South China Sea at 2019-06-1355125410702379±789Proposed
    Northeastern South China Sea at 2019-06-14688748031745±423Proposed
    Northeastern South China Sea at 2019-06-15174140612322812±1222Proposed
    Northeastern South China Sea at 2019-06-162379396621838±1013Proposed
    Northeastern South China Sea at 2019-06-1738414269542764±1718Proposed
    Northeastern South China Sea at 2019-06-1856819308243322±1205Proposed
    Yellow Sea at 2005-033638±177913
    East China Sea at 2005-052075±98513
    Northeastern South China Sea at 2012-092150±15017
    Central South China Sea at 2012-101000±20017
    Urban area in Beijing at 2011-1241081835985382315233
    Table 1. Aerosol number concentrations of three modes in different regions
    DateSingle peakDouble peakTriple peak
    2019-06-082071368
    2019-06-1031122311
    2019-06-133081232
    Table 2. Particle size distribution statistics of marine aerosols
    AreaMode 1Mode 2
    σgmdgm /nmN0 /cm-3σgmdgm /nmN0 /cm-3
    Northeastern South China Sea at 2019-06-081.7121.72471.31105.591
    Northeastern South China Sea at 2019-06-101.2891.455
    Northeastern South China Sea at 2019-06-131.2898.232
    Yellow Sea at 2005-031.2331.08511.4891.0248
    East China Sea at 2005-051.3141.03611.42105.0124
    Table 3. Log-normal fitting parameters of number concentration spectra in three sea areas
    Pei Tang, Shiyong Shao, Qiang Liu, Manman Xu, Haixu Wang, Yong Han. Particle Size Distribution Analysis of Submicron Marine Aerosol Based on Shipboard Measurement[J]. Acta Optica Sinica, 2023, 43(6): 0601008
    Download Citation