• Laser & Optoelectronics Progress
  • Vol. 58, Issue 12, 1230001 (2021)
Yuanzhe Chen1, Qiaohua Wang1、2、*, Sheng Gao1, and Lu Mei1
Author Affiliations
  • 1College of Engineering, Huazhong Agricultural University, Wuhan, Hubei 430070, China
  • 2Ministry of Agriculture Key Laboratory of Agricultural Equipment in the Middle and Lower Reaches of the Yangtze River, Wuhan, Hubei 430070, China
  • show less
    DOI: 10.3788/LOP202158.1230001 Cite this Article Set citation alerts
    Yuanzhe Chen, Qiaohua Wang, Sheng Gao, Lu Mei. Nondestructive Testing Model for Textural Quality of Freshwater Fish in Storage Using Near-Infrared Spectroscopy[J]. Laser & Optoelectronics Progress, 2021, 58(12): 1230001 Copy Citation Text show less
    Absorbance curves of fish for different storage time
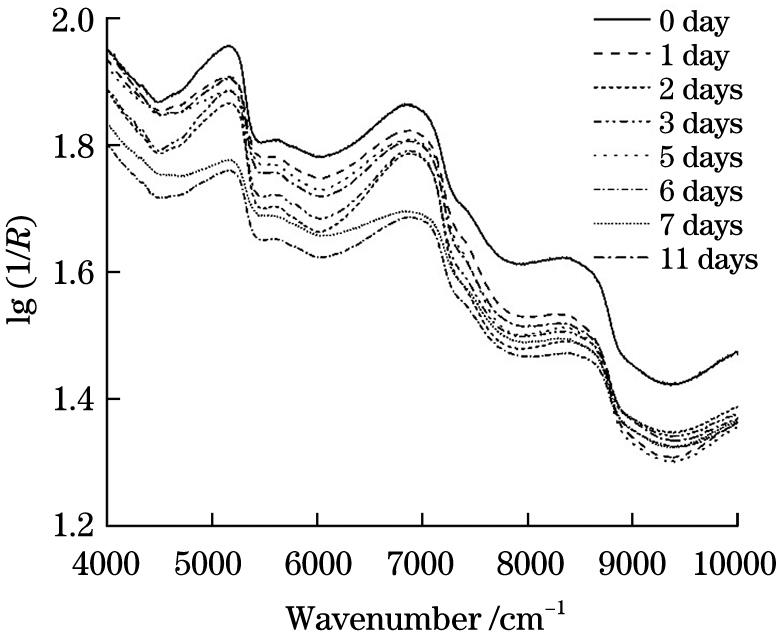
    Fig. 1. Absorbance curves of fish for different storage time
    Dimensionless textural index versus storage time
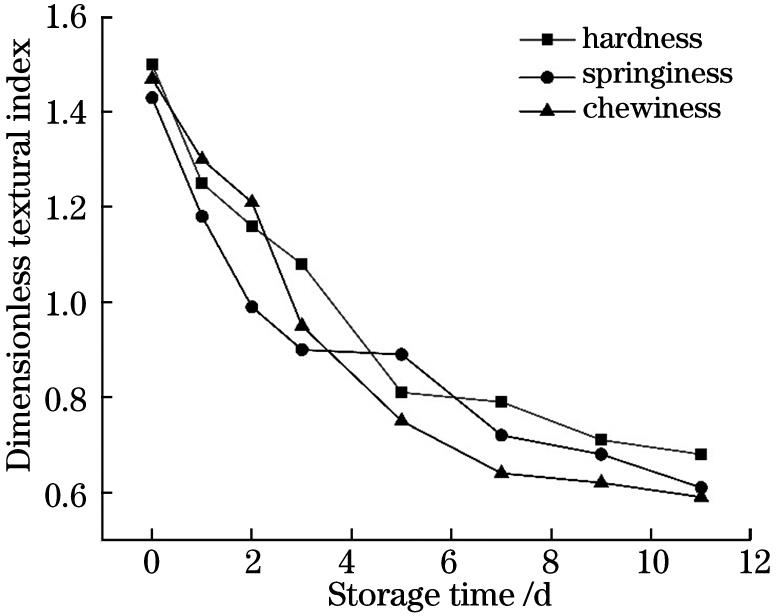
    Fig. 2. Dimensionless textural index versus storage time
    Raw spectra of samples and spectra after S-G pretreatment. (a) Raw spectra; (b) spectra after S-G pretreatment
    Fig. 3. Raw spectra of samples and spectra after S-G pretreatment. (a) Raw spectra; (b) spectra after S-G pretreatment
    Selection of characteristic wavelengths by CARS-PLS model.(a) Numbers of sampled variables;(b) RMSECV; (c) regression coefficients path
    Fig. 4. Selection of characteristic wavelengths by CARS-PLS model.(a) Numbers of sampled variables;(b) RMSECV; (c) regression coefficients path
    Variation of model RMSE and selection of characteristic wavelengths. (a) Variation of RMSE; (b) selection of characteristic wavelengths
    Fig. 5. Variation of model RMSE and selection of characteristic wavelengths. (a) Variation of RMSE; (b) selection of characteristic wavelengths
    Scatter plot of predicted and measured values of sample hardness
    Fig. 6. Scatter plot of predicted and measured values of sample hardness
    Number of samplesTextural indexMinimumMaximumMean±standard deviation
    Calibration set(120)Hardness /NSpringinessChewiness /mJ3.050.160.089.501.354.765.68±1.820.71±0.271.25±1.12
    Prediction set(40)Hardness /NSpringinessChewiness /mJ2.980.210.119.481.324.585.76±2.570.82±0.351.54±1.83
    Table 1. Data statistics of partitioning sample sets by SPXY algorithm
    Textural indexFeature band extraction methodNumber of characteristic wavelengthFactorCalibration setPrediction set
    RcRMSECRpRMSEP
    HardnessRAW1557100.7822.3680.7533.543
    CARS7370.9540.4400.9470.538
    SCARS132100.9460.6570.9340.875
    SPA3070.8631.2540.8371.254
    SpringinessRAW1557120.8273.2260.8044.215
    CARS8490.9361.0270.9272.193
    SCARS9770.9151.3450.8971.547
    SPA3590.8492.6580.8143.012
    ChewinessRAW155782.6582.6580.7043.214
    CARS65100.9050.4250.8970.587
    SCARS7470.8970.4830.9051.153
    SPA44111.2390.7560.7561.547
    Table 2. Results of PLSR model established by the method of primary characteristic wavelength extraction
    Textural indexWavelength /nm
    Hardness401.12,433.13,476.46,580.85,679.97,760.20,824.22,873.21,895.58,999.71
    Springiness418.48,514.13,586.25,621.73,659.15,743.88,812.65,918.33
    Chewiness430.82,492.91,602.06,707.74,826.15,988.15
    Table 3. Secondary characteristic wavelength extracted by CARS and SPA algorithms
    Textural indexCharacteristic band extraction methodNumber of characteristic wavelengthCalibration setPrediction set
    RcRMSECRpRMSEP
    HardnessCARS+SPA100.9680.7530.9640.846
    SCARS+SPA130.9260.8570.9280.983
    SpringinessCARS+SPA80.9470.8270.9390.897
    SCARS+SPA90.9130.7460.9041.689
    ChewinessCARS+SPA60.9080.6590.9150.875
    SCARS+SPA80.9270.9860.9260.964
    Table 4. Results of PLSR model based on quadratic characteristic wavelength extraction method
    Yuanzhe Chen, Qiaohua Wang, Sheng Gao, Lu Mei. Nondestructive Testing Model for Textural Quality of Freshwater Fish in Storage Using Near-Infrared Spectroscopy[J]. Laser & Optoelectronics Progress, 2021, 58(12): 1230001
    Download Citation